
This article provides a meta-analysis of the technical analysis available on Shiba Inu (SHIB) as of 6 June 2023.
Shiba Inu (SHIB) is a meme coin created in 2020. It is one of the most popular cryptocurrencies in the world, with a market capitalization of over $10 billion.
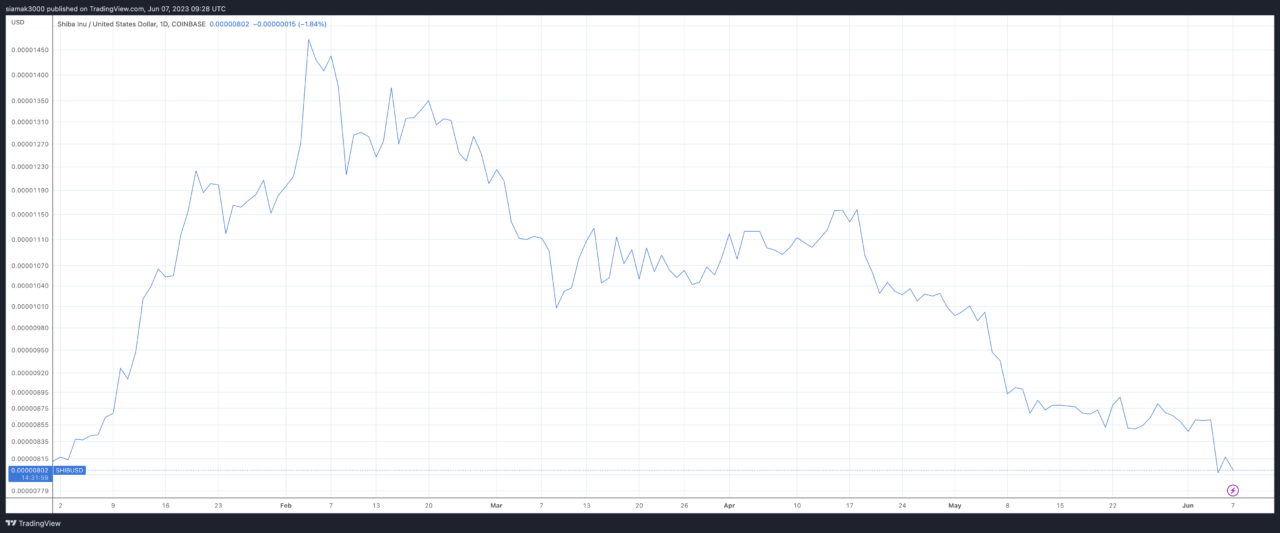
SHIB has been on a wild ride since its inception. In October 2021, it reached an all-time high of $0.00008616. However, it has since fallen back to its current price of $0.0000075.
Technical Analysis
The technical analysis of SHIB is mixed. Some analysts believe the coin is poised for a breakout, while others believe it is headed for further decline.
Here is a brief explanation of the jargon used in this article:
- Relative Strength Index (RSI): The RSI is a momentum indicator that measures the speed and change of price movements. A reading of 70 or above indicates that the market is overbought, while a reading of 30 or below indicates that the market is oversold.
- Moving Average Convergence Divergence (MACD): The MACD is a trend-following indicator that uses moving averages to identify changes in momentum. A bullish MACD crossover occurs when the MACD line crosses above the signal line, while a bearish MACD crossover occurs when the MACD line crosses below the signal line.
- Fibonacci Retracement Levels: Fibonacci retracement levels are used to identify potential support and resistance levels. These levels are based on the Fibonacci sequence, which is a series of numbers that are found in nature and art.
- Ichimoku Cloud: The Ichimoku Cloud is a technical indicator that uses moving averages, price action, and support and resistance levels to identify potential trading opportunities.
The Relative Strength Index (RSI) is currently at 40, which indicates that SHIB is oversold. This could be a sign that the coin is due for a rebound.
The Moving Average Convergence Divergence (MACD) indicator is also showing signs of a bullish reversal. The MACD line has crossed above the signal line, which is bullish.
The Fibonacci retracement levels show that SHIB has retraced 61.8% of its move from the $0.00008616 all-time high to the current price of $0.0000075. This suggests that SHIB could be poised for a rebound to the $0.000010 level.
The Ichimoku cloud is also showing signs of a bullish reversal. The price is currently above the cloud, and the cloud is turning green, which is a bullish signal.
Based on this technical analysis, it is possible that SHIB could reach the $0.000010 price target in the near future.
However, it is important to remember that technical analysis does not guarantee future performance. The price of SHIB could go up or down, regardless of the technical analysis. If you are considering investing in SHIB, it is essential to do your own research and consult with a financial advisor.
Featured Image Credit: Photo by “LeandroDeCarvalho” via Pixabay