
XMR/USD Long-term Trend: Ranging
- Resistance levels: $70, $80, $90
- Support levels: $60, $50, $40
The price of Monero is in a bullish trend. The crypto’s price is moving above its 12-day EMA and its 26-day EMA. XMR’s price has been facing resistance at the $72.50 level since April 3. On April 8, the bulls tested the resistance and were resisted.
As a result, the crypto’s price fell to a low of $64, at the 0.382 Fibonacci retracement level. Currently, the crypto’s price is trading between the Fib. levels of 0.236 and 0.382. On April 16, the crypto resumed its bullish trend with the support of the 0.382 Fib. retracement level. The crypto’s price is approaching the $72.50 resistance level once again.

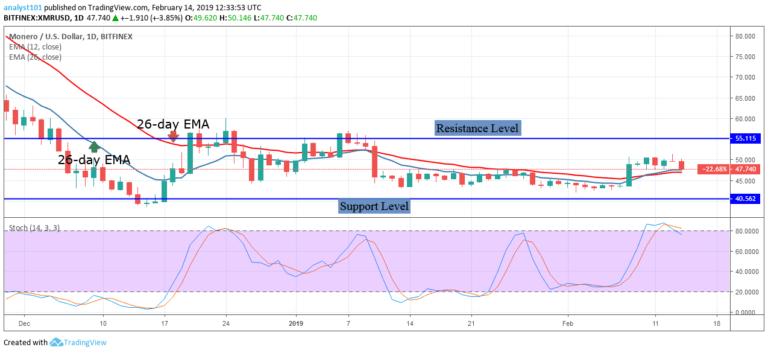
If the bulls managed to break through Monero’s resistance, the crypto will see its price rally to over $100, while failure could see it drop into the Fib. zone once again. The Stochastic indicator shows XMR is overbought as it’s at 60, indicating XMR is in a bullish momentum and being a buy signal.
The views and opinions expressed here do not reflect that of CryptoGlobe.com and do not constitute financial advice. Always do your own research.


