

ETHUSD Medium-term Trend: Bearish
- Resistance Levels: $230, $240, $250
- Support Levels: $150, $140, $130
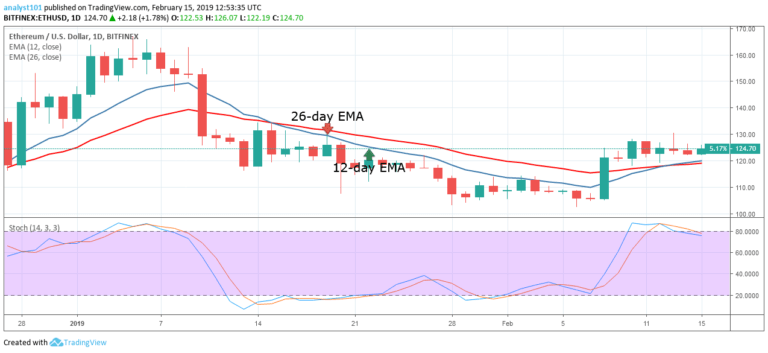
Yesterday, April 25, the price of Ethereum was in a bearish trend. An initial bearish trend from April 9 ended on April 15 when faced with the support at the 26-day EMA. A second bearish trend started on April 19 but ended on April 25. This second bearish trend broke the 12-day EMA and the 26-day EMA to reach a bearish zone.
The price of ETH fell to a support at the 0.618 Fibonacci retracement level. If this level holds the bulls will be able to resume their trend to break the EMAs and retest the $176 level.
On the other hand, if the 0.618 Fib. retracement level is broken; the crypto’s price will depreciate to a low of $140. The Stochastic indicator is in the oversold region but below 40 which indicates the crypto’s price is in bearish momentum and is a sell signal.
ETHUSD Short-term Trend: Bearish

On the 4-hour chart, the price of Ethereum is in a bearish trend. The crypto’s price was recently on a downward correction as the bears broke the 12-day EMA and the 26-day EMA to reach a low at $154.55.
The price of Ethereum is likely going to further depreciate because it is in a bearish trend. The Stochastic indicator is in the oversold region but above 20 which indicates that the crypto is in bullish momentum and is a buy signal.
The views and opinions expressed here do not reflect that of CryptoGlobe.com and do not constitute financial advice. Always do your own research.


