

ETHUSD Medium-term Trend: Bearish
- Resistance Levels: $230, $240, $250
- Support Levels: $150, $140, $130
Ethereum’s price is in a bullish trend. On April 8, the bulls managed to bring ETH to a high of $187.98. The bulls faced resistance at the $184 level and as a result the price fell to a support at the 12-day EMA. The crypto’s price ranged above the 12-day EMA and was resisted again at the $170 level.
ETH has now falling to the $160 mark, where it has support. The price of the cryptocurrency is trading between that support and the $170 level, where it faces resistance. If the bulls break through it, it may go to $184 or even $200.
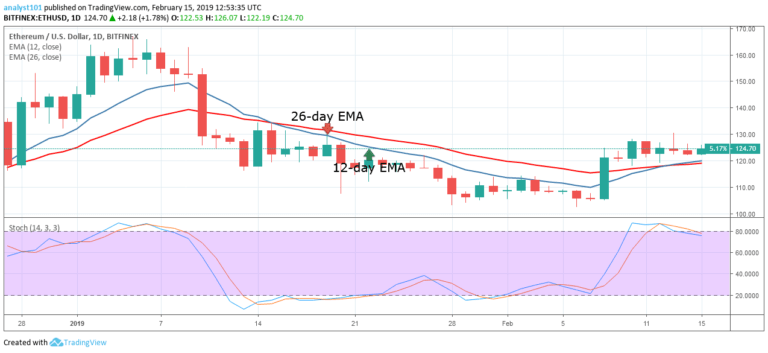
If the bulls fail to break through the $170 mark, the cryptocurrency’s price is set to range close to its resistance. The Stochastic indicator is in the overbought region, but below 60, indicating bearish momentum.
ETHUSD Short-term Trend: Bullish

On the 4-hour chart, the price of Ethereum is in a bullish trend. Since April 15, the crypto’s price has been making a series of higher highs and higher lows. On April 17, a Doji candlestick appeared indicating that the buyers and sellers were undecided about the direction of the market.
The bulls have taken over but the current bullish trend is likely to be over soon. The crypto’s price is expected to hit the $170 price level but may face resistance afterwards.
Meanwhile, the Stochastic Indicator is in the overbought region but above 80 which indicates that the crypto is in a strong bullish momentum and is a buy signal.
The views and opinions expressed here do not reflect that of CryptoGlobe.com and do not constitute financial advice. Always do your own research.


