

BTCUSD Medium-term Trend: Bullish
- Resistance levels: $7,000, $7,200, $7,400
- Support levels: $5,100, $4,900, $4,700
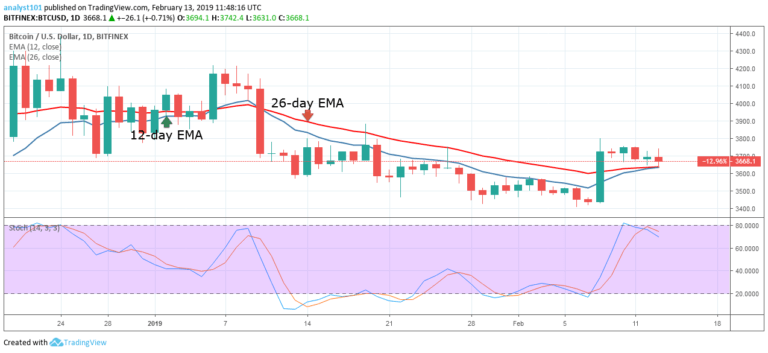
The price of Bitcoin had been trading in the bullish trend zone.The crypto’s price is above the 12-day EMA and the 26-day EMA, indicating that price is likely to rise. Yesterday, the crypto’s price rose and reached a high of $5,310.90 but the bulls were resisted.
The bulls could not break the $5,310.90 resistance level for the third time. Today, the crypto’s price is retracing as a result if the resistance. If price retraces, it may fall to the $5,200 support level or to the support of the 12-day EMA. This has been the scenario since April 16.
However, if the bulls fail to break the resistance level, a price breakout will do. Meanwhile, the stochastic indicator is at the overbought region but below the 80% range which indicates that the crypto is in a bearish momentum and a sell signal.
BTC/USD Short-term Trend: Ranging

On the 4-hour chart, the price of Bitcoin is in a tight range bound movement. Since the bulls broke the $5,200 resistance level, the $5,300 price level is another hurdle for the price of Bitcoin. Presently, the crypto’s price is in a range bound movement between the levels of $5,200 and $5,300. The bulls have failed to break the resistance level on two occasions.
The bulls are making another attempt to break the $5,300 price level. The BTC price will rise to reach the highs of $5,500 and $6,000 if the bulls break the resistance level. On the other hand, if the bulls fail to break the resistance level, the crypto will continue its range bound movement.
Meanwhile, the stochastic indicator is at the overbought region but above the 60% range which indicates that the crypto is in a bearish momentum and a sell signal.
The views and opinions expressed here do not reflect that of CryptoGlobe.com and do not constitute financial advice. Always do your own research.


