
 Ethereum Chart By Trading View
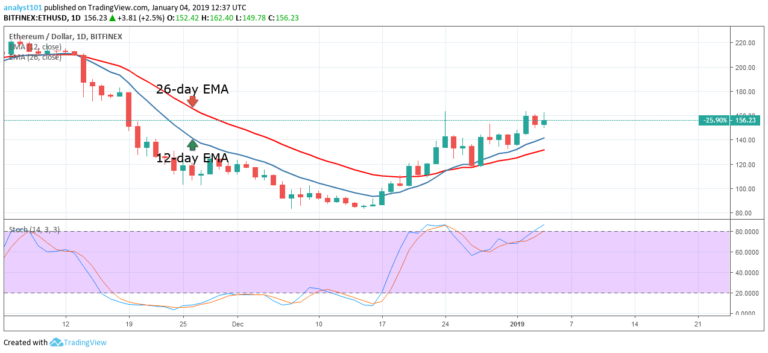
ETHUSD Medium-term Trend: Bullish
- Resistance Levels: $230, $240, $250
- Support Levels: $150, $130, $110
The ETHUSD pair was in a bearish trend yesterday. The crypto’s price was resisted because it tested the resistance at $160.72 . The ETHUSD pair was first resisted on December 24, when the price reached a high of $163.50. Today, the price of Ethereum is making the third attempt at breaking above the $160 price level.
On the upside if the bulls succeed in breaking the resistance, the crypto will rally at the $180 and $220 price levels. On the downside if the bulls fail to break the $160 price level, the crypto can drop down to the $130 price level. Meanwhile, the stochastic indicator is in the overbought region above 80% range. This indicates that the price of Ethereum is in a strong bullish momentum.
ETHUSD Short-term Trend: Bullish
 Ethereum Chart By Trading View
On the 4-hour chart, the price of Ethereum was in a bearish trend yesterday. The ETH price fell to the 12-day EMA. The 12-day EMA acted as a support for the bulls, as the crypto makes another attempt at the resistance level. Meanwhile, the crypto’s price is above the 12-day EMA and the 26-day EMA which indicates that the price is in the bullish trend zone.
Similarly, the stochastic indicator is approaching the overbought region but it is above the 60% range. This indicates that Ethereum is in a bullish momentum and a buy signal.
The views and opinions expressed here do not reflect that of CryptoGlobe.com and do not constitute financial advice. Always do your own research.


