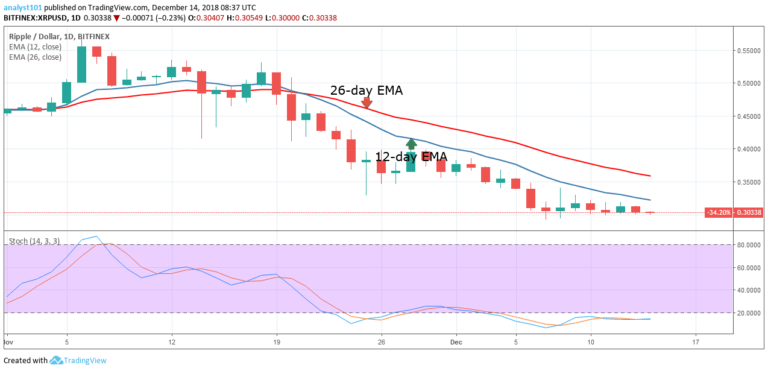

XRPUSD Medium-term Trend: Ranging
- Resistance Levels: $0.56, $0.58, $ 0.60
- Support Levels: $0.30, $0.28, $0.26
The XRPUSD pair is in the bearish trend zone te despite the slight price fall. Yesterday, the crypto fell from the high of $0.31386 to the low of $0.30409. The XRP price is still ranging above the $0.30 price level. The price decline is below the 12-day EMA and the 26-day EMA as the crypto continues its fall.
Nevertheless, the XRP price has a chance of immediate price fall if the support level at $0.29 is broken. In addition, the Stochastic indicator is still in the oversold region below the 20% range. The Stochastic confirms the crypto having a strong bearish momentum and a sell signal. The XRP price fall is expected at the previous low of $0.24 and the next support level.
XRPUSD Short-term Trend: Ranging

On the short term trend, the XRP price is in a sideways trend. The XRP price is in the bearish trend as the price fluctuates above the $0.30 price level. On December 7, the price rose from its low and was resisted by the 12-day EMA Then it retraced to the low of $0.30 on December 8 and commenced a bullish movement.
This was resisted at the 26-day EMA. This had been the scenario since the range bound movement began. Meanwhile, the crypto’s price is below the 12-day EMA and the 26-day EMA indicating that the price is likely to fall.
The views opinions expressed here do not reflect that of CryptoGlobe.com and do not constitute financial advice. Always do your own research.