
ETHUSD Long-term Trend – Ranging
- Distribution territories: $200, $220, $240
- Accumulation territories: $60, $40, $20
The ETHUSD market has seen a notable decrease in valuation between November 19 and 22 while $160 and $120 marks were broken southwards. The cryptocurrency pair had in the long run gone downwards to test the last immediate territory of $100 on about three occasions.

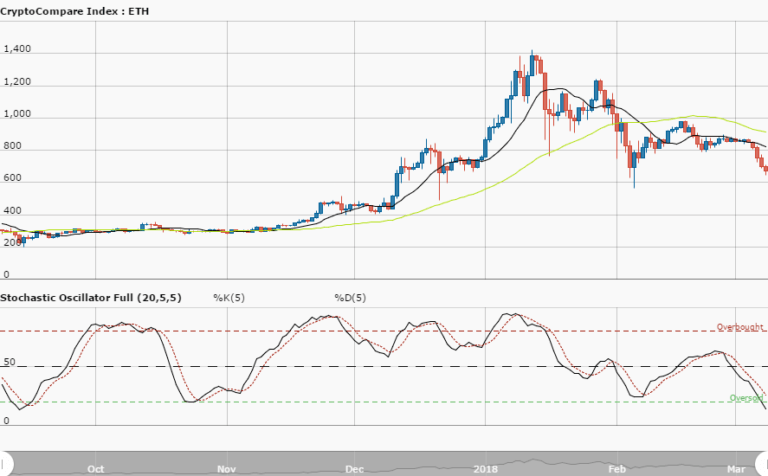
All the trading sessions have been occurring underneath the 14-day SMA’s trend-line sell signal until now. The market has been hovering within $120 and $100 territories below the 14-day SMA’s trend-line. There is a visible space between the two SMAs as the 50-day SMA is located over the 14-day SMA.
The Stochastic Oscillators still appear moving in a consolidation pattern around range 25. That suggests that bears are not yet done with the selling. The $100 mark now appears as a pivotal market point that its breaking southwards may result in having a new low mark between $80 and $40 points. A break above $140 territory could allow the crypto to witness a high value around $180 or $200 where the 50-day SMA is found.
The views and opinions expressed here do not reflect that of CryptoGlobe.com and do not constitute financial advice. Always do your own research.


