
ZECUSD Medium-term Trend: Bearish
Supply levels: $215, $210, $205
Demand levels: $185, $190, $195
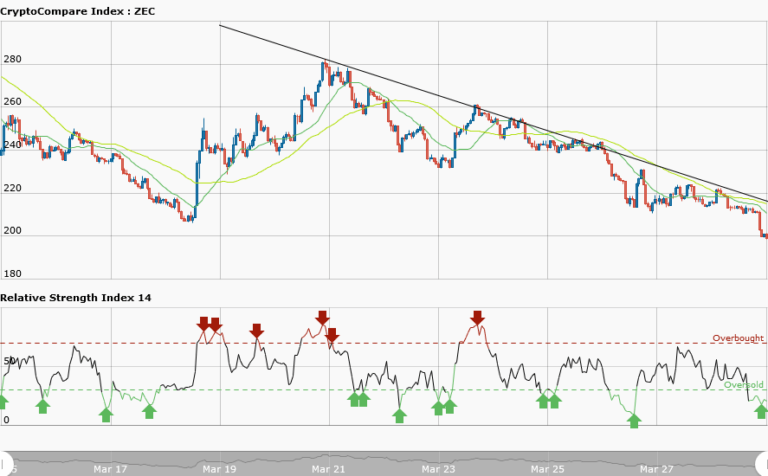
ZCash is presently in a downtrend with a bearish trend line showing the direction of the market. On March 21, price of ZCash fell from $280 to as low as $199.97 as at the time of writing. As a trader you can profit from the downtrend if you had followed the trend from its beginning. Remember, if you want to trade along the trend, you must focus your attention on the resistance levels.
From the weekly chart, you will find a bearish trend line showing the resistance levels where a trader can short his trades. The fact is that in a downtrend, you will find price retracements and pull backs. For instance, in a downtrend price will retrace from the recent low and create a resistance level as the price pulls back ,where you have the opportunity to short your trades.
Meanwhile, the RSI period 14 is level 23 which indicates that the market is oversold suggesting bulls to take control of the market.
ZECUSD Short-term Trend: Bearish

In the daily chart, ZCash is in a downtrend. Price fell from $220 to $210 and commenced a range bound movement for a whole day before falling to its present low of $199.97.The RSI period 14 is level 30 which indicates that the market is oversold suggesting bulls to take control of the market.
The views and opinions expressed here do not reflect that of CryptoGlobe.com and do not constitute financial advice. Always do your own research


