

XRPUSD Medium-term Trend: Bearish
Supply Levels: $0.58, $0.57, $0.56
Demand levels: $0.52, $0.53, $0.54
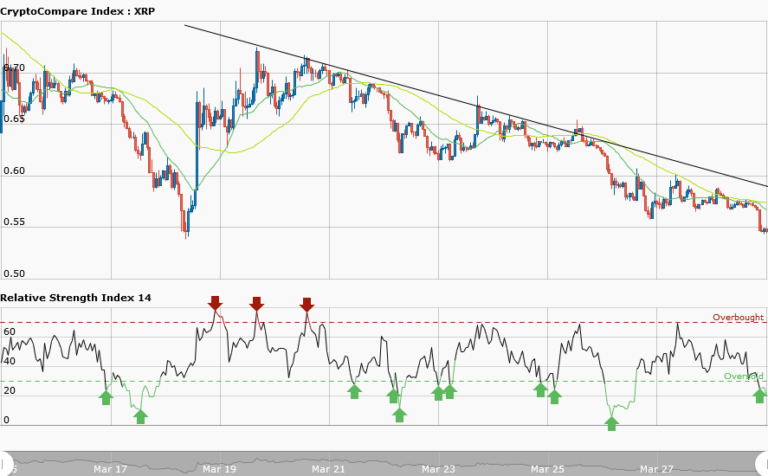
The XRPUSD pair is also in a downtrend with a bearish trend line drawn across the price bars. From the weekly chart, price of Ripple was consistently falling from $0.70 to its present low at $0.54 as at the time of writing. A downtrend is present when prices make series of lower highs and lower lows. Assuming, you are following the downtrend from the price at $.70, you will find price retracements and pull backs.
The fact is that in a downtrend, if price retraces from the recent low, a resistance level would be created as price pulls back. Then you will have the opportunity to short your trades. Meanwhile, the RSI period 14 is level 25 which indicates that the market is oversold suggesting bulls taking over the market.
XRPUSD Short-term Trend: Bearish

In the daily chart, XRPUSD pair has a bearish pattern. The 50-day moving average and 20-day moving average are trending southward. Meanwhile, the RSI period 14 is level 47 which indicates that price is in range bound zone..
The views and opinions expressed here do not reflect that of CryptoGlobe.com and do not constitute financial advice. Always do your own research


