
LTCUSD Medium-term Trend: Bearish
Resistance: $135, $130, $125
Support: $105, $110, $115
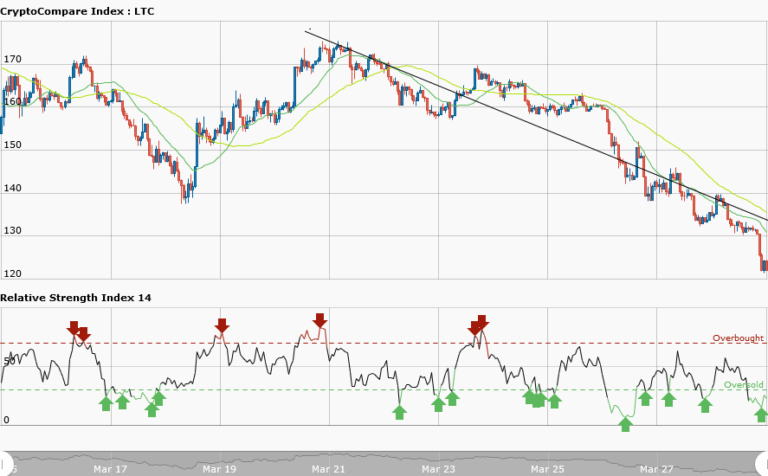
Price of Litecoin had been on a downtrend since March 19, 2018. From the weekly chart, the bearish trend line shows the resistance levels of price where traders can short their trades. In a downtrend, your focus is to spot resistance levels where you can short your trades. You can spot these levels by waiting for price to retrace from the recent low and as it pulls back a resistance level will be created where you can short your trades.
However, for about ten days ago, price of Litecoin had been fluctuating between the resistance at $170 and the support at $140. The assumption was that a possible breakout at the resistance level would enable traders place long trades and short trades at the support levels. Price actually broke the support level and it is trading at $122.11 as at the time of writing.
LTCUSD Short-term Trend: Bearish

Price of Litecoin has a bearish outlook in the daily chart. The bearish outlook was in stages of decline. Price fell from $140 to $130 and commenced a range bound movement for a whole day. While in the range bound zone, price fell to its present lows of $122.11.Meanwhile, the RSI period 14 is level 42 which indicates that price is in the range bound zone.
The views and opinions expressed here do not reflect that of CryptoGlobe.com and do not constitute financial advice. Always do your own research