

ETHUSD Medium-term Trend: Bearish
Resistance: $450, $440, $430
Support: $390, $400, $410
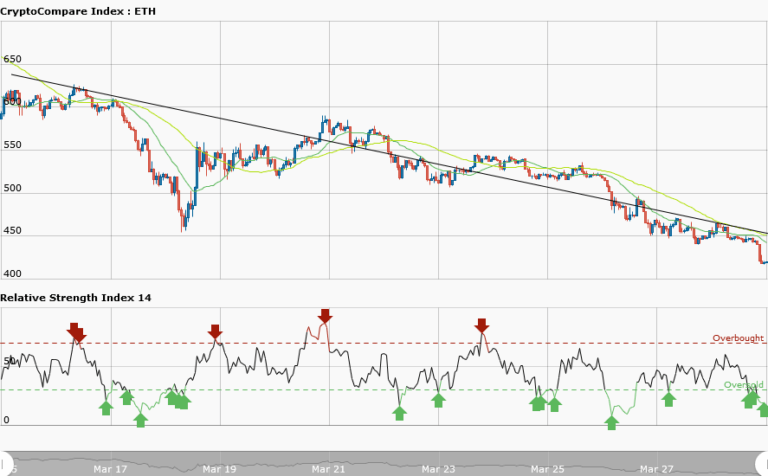
ETHUSD pair is in a smooth downtrend.The 50-day and 20-day moving averages are trending southward indicating price decline. The bearish trend line shows the resistance levels of price where traders can short their traders. On March 19, 2018, price of Ethereum had been fluctuating between the resistance at $600 and the support at $450. And traders were told that they should place short trades if price break the support level at $450.
On the other hand, they should place long trades if price breaks the resistance level at $600. However, price of Ethereum has broken the support level at $450 and may revisit its low at $400. It is presently trading at $418.06. Meanwhile, the RSI period 14 is level 19 which indicates that the market is oversold suggesting bulls taking control of the market.
ETHUSD Short-term trend: Bearish

Price of Ethereum is in a downtrend. The moving averages are trending southward. From the daily chart, price of Ethereum is consolidating at $420 for another breakout. However, the RSI period 14 is level 54 which indicates that price is in the range bound zone. The demand levels of price may be breached.
The views and opinions expressed here do not reflect that of CryptoGlobe.com and do not constitute financial advice. Always do your own research.


