
XRPUSD Long-term Trend – Bullish
Distribution territories: $0.55, $0.65, $75.
Accumulation territories: $0.20, $0.15, $0.10.
Ripple’s XRP suffered a considerable loss in its market trading sessions between Aug 12, 13 and 14 respectively. The cryptocurrency managed to change its downward path on Aug. 15, to test $0.30. Eventually, it was able push past it on Aug. 17.

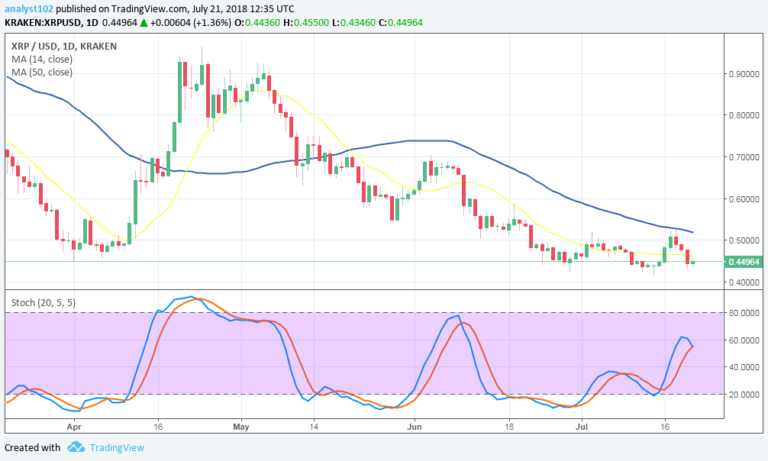
XRP is now pushing northward against the trend-line of the 14-day SMA. Breaking the $0.30 price line means the crypto is now moving towards the distribution territory of $0.40. The 50-day SMA is located above the 14-day SMA, and they are both above XRP’s price.
The Stochastic Oscillators are pointing north within the oversold zone. This means the market may soon turn bullish. The sudden upward rise that occurred in the value of this crypto yesterday, on Aug 17, seems to be a strong signal that it isn’t being overwhelmed by the bears’ presence. Traders may consider entering long positions with proper financial management in mind.
The views and opinions expressed here do not reflect that of CryptoGlobe.com and do not constitute financial advice. Always do your own research.


