
As of 20:10 UTC (16:10 Eastern Time) on Tuesday (August 18), Bitcoin is trading above $12,000, gold is hovering around the $2,000 an ounce level, and the S&P 500 Index closed at 3,389.78, which is a new all-time high (ATH).
Bitcoin
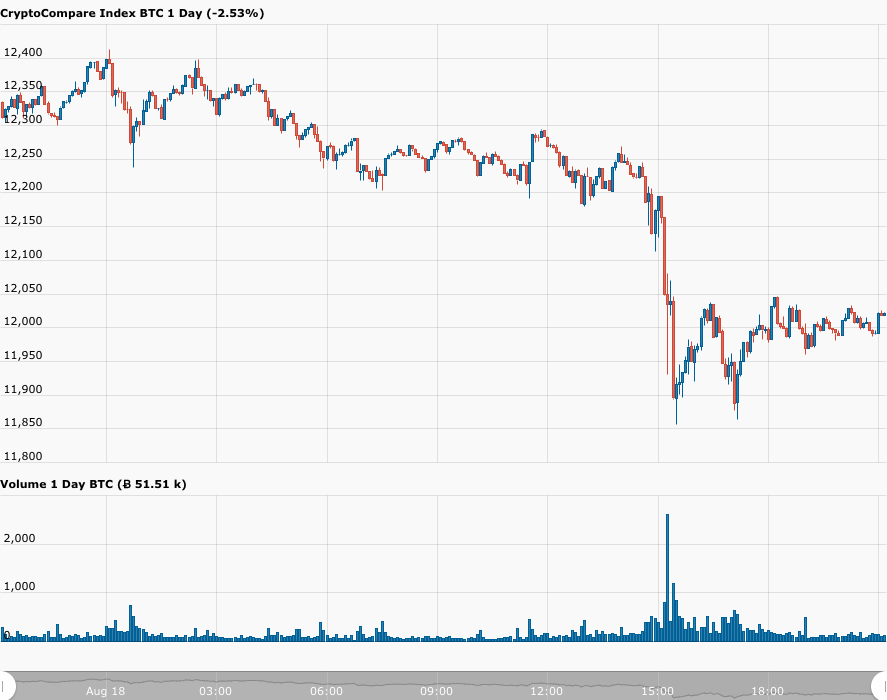
According to data from CryptoCompare, Bitcoin started the day (00:00 UTC) at $12,301, and then got as high as $12,397 (at 01:30 UTC).
By 14:00 UTC, BTC was trading around $12,195. However, within the next 30 minutes, the BTC price fell below $12K to $11,916.
Currently (i.e. at 20:14 YTC), Bitcoin is hovering just above the $12K level, trading around $12,023, which means that it is down 2.45% vs USD in the past 24-hour period.
Popular crypto analyst/trader Josh Rager, who is also a Co-Founder of online crypto learning platform Blockroots, as well as an advisor to several blockchain startups, offered this bit of technical analysis of Bitcoin’s latest price action:
Gold
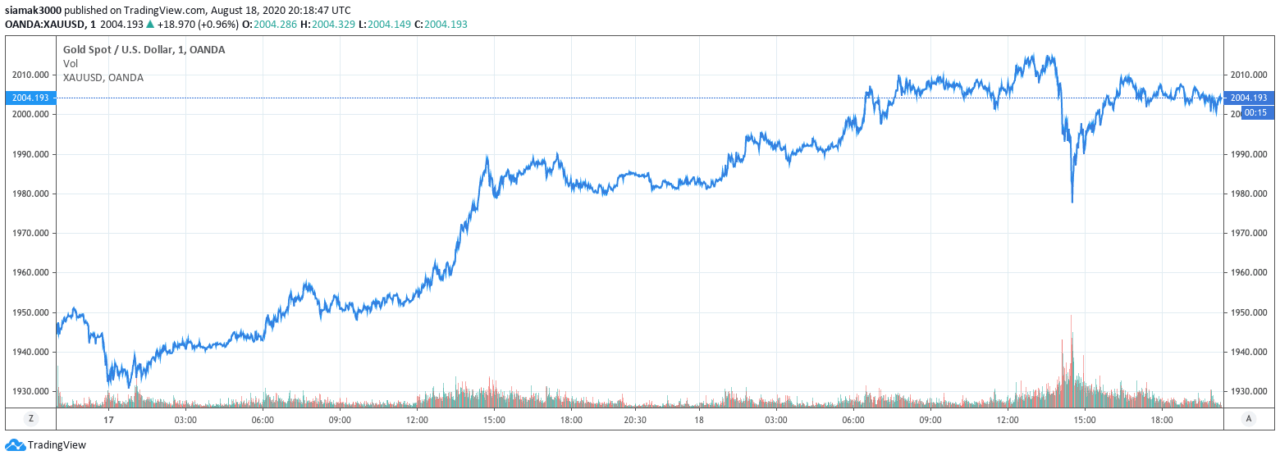
Around 15:00 BST (10:00 EDT), gold was trading around $2,000. By 15:30 BST (10:30 EDT), it had dropped to the intraday low of $1,977, and by 16:45 BST (11:45 EDT), it had managed to get back above the $2,000 level.
Currently (as of 21:55 BST or 16:55 EDT), gold is trading at $2,001.91, up $18.75 (or 0.95%) for the day.
Philip Streible, Chief Market Strategist at Blue Line Futures, told Kitco News:
“This is just a sign of how strong demand is in the marketplace… There are just too many people waiting on the sidelines waiting to get long. Investor are trying to protect themselves from the impending rise in inflation.”
Kitco’s report also said that in a note to clients published earlier today, UBS analysts had made the following price prediction for gold:
“With the Fed continuing to suppress nominal rates and inflation expectations rising, we maintain our end-year forecast of $2,000/oz… In the near-term, gold may move as high as $2,300/oz, particularly if geopolitical tensions rise.”
U.S. Equities
The S&P 500 climbed 0.23% higher today to close at a new all-time high today: 3,389. The S&P 500 closed 2019 at 3,230.78. This means that in the year-to-date (YTD) period, it has gone up 4.92%.
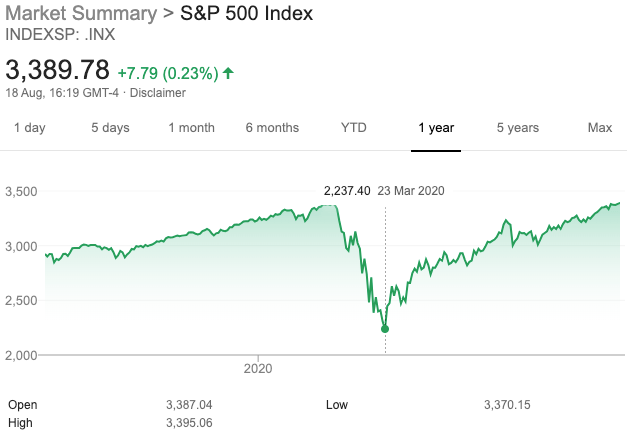
However, what is much more impressive is that the S&P 500 has managed to go up 51.50% since its close on 23 March 2020.
According to a report by CNBC, Shannon Saccocia, Chief Investment Officer at Boston Private, says:
“Equity markets are reflecting the massive monetary and fiscal stimulus that has been injected over the past four months…
“Couple that with a more robust economic recovery than what was expected at the depths of the crisis, and interest rates once again at zero, and the rationale to diversify away from risk assets is hard to pinpoint.”


