XRPUSD Medium-term Trend: Bullish
- Resistance Levels: $0.56, $0.58, $ 0.60
- Support Levels: $0.29, $0.27, $0.25
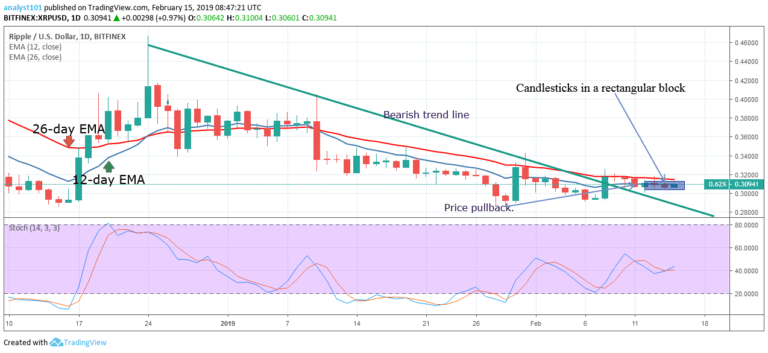
Yesterday, April 29, the XRP price was in a range bound movement below the 12-day EMA and the 26-day EMA. On April 26, a bullish candlestick broke the bearish trend line signaling the end of a bearish trend. Thereafter, the crypto’s price began a range bound movement below the EMAs before it resumed its bullish trend.
Yesterday it was anticipated that if the bulls broke the 12-day EMA and the 26-day EMA the crypto’s price would revisit the highs of $0.33 and the $0.34. However, the bulls are likely to face resistance at the $0.32 and $0.33 price levels.
On the downside, if the bulls fail to break the EMAs, the XRP price will resume its range bound movement below the EMAs. Meanwhile, the stochastic is in the oversold region but above the 20% range. This indicates that the XRP price is in a bullish momentum and a buy signal.
XRPUSD Short-term Trend: Bullish
On the 4-hour chart, the XRP price was in a range bound movement. On April 26 and 28, the bulls attempted to break the $0.31 resistance level but failed. That was one reason the price was ranging below the resistance level. Today the bulls have broken the $0.31 resistance level and it is approaching the $0.32 resistance level.
However, the crypto’s price has two hurdles to jump over. On the upside, if the bulls sustain a price above the EMAs, the $0.32 and $0.33 price levels should be overcome.
Meanwhile, the stochastic indicator is in the overbought region but above the 60 % range which indicates that the XRP price is in a bullish momentum and a buy signal.


