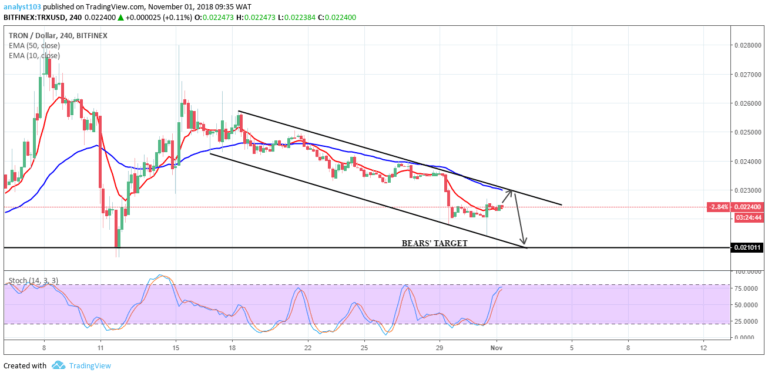
TRX/USD Medium-term Trend: Bearish
- Supply zones: $0.04000, $0.05000, $0.06000
- Demand zones: $0.01000, $0.00900, $0.00800
TRON’s TRX is in a downtrend in its medium-term outlook. The bears managed to keep controlling the market during the weekend with TRX’s price remaining below its EMAs’ crossover, within the range. The lower demand area of the range at $0.02550 was broken shortly after yesterday’s session opened.
TRX dropped to $0.02437 in the demand area, a daily low seen before the bulls pushed its price up. This led to a high of $0.02523, with forward upward movement being rejected at the 10-day EMA. TRX is currently below its EMAs, indicating its downtrend. The $0.0234 mark may be retested.
TRX/USD Short-term Trend: Bearish
The cryptocurrency is in a bearish trend in its short-term outlook. The bears broke the lower demand area of the range at $0.02601 with an inverted hammer during yesterday’s trading session. As a result TRX’s price was further pushed down to $0.02437 in the demand area before exhaustion set in.
The EMAs are far apart which suggests a strong downtrend. This may have been confirmed by the signal of the Stochastic Oscillators, which is pointing down at 33.
The views and opinions expressed here do not reflect that of CryptoGlobe.com and do not constitute financial advice. Always do your own research.


