
NEO/USD Long-term Trend: Bearish
- Supply zone: $15.00, $20.00, $25.00
- Demand zone: $2.00, $1.00, $0.50
NEO continues in the downtrend in its long-term outlook. The bears sustained the momentum with the break of the lower line of the bearish flag on 23rd April with a drop to $10.32 in the demand area. This was significant with the break of the 50-EMA, a strong resistance. NEO closed the week lower at $9.60 in the demand area as exhaustion set in with the formation of a bullish spinning top.

The price was up at $10.37 in the supply area during yesterday’s session, with resistance against further upward movement at 50-EMA. This should be seen as a pullback to confirm the bearish continuation in the long-term.
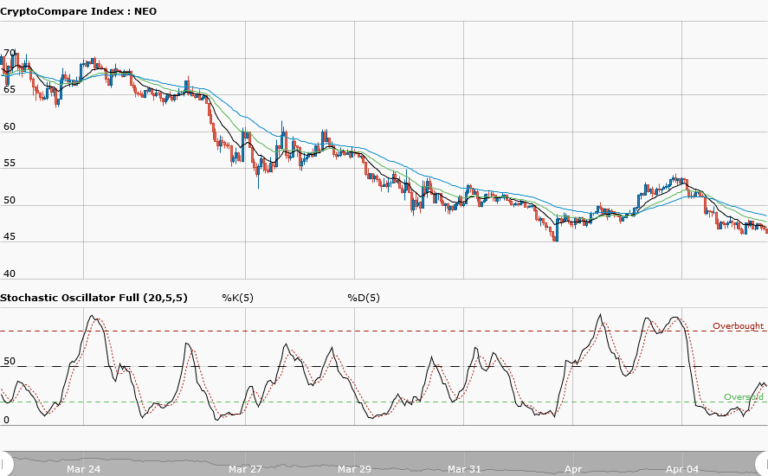
With the stochastic oscillator signal pointing down at 19% in the oversold region and the price below the two EMAs crossover, it suggests downward momentum in price.
The journey to $8.50 in the demand area remains a possibility with more candles opened and closed below the EMAs crossover in the days ahead.
The views and opinions expressed here do not reflect that of CryptoGlobe.com and do not constitute financial advice. Always do your own research.


