

XMRUSD Medium-term Trend: Bearish
- Supply zones: $120, $130, $140
- Demand zones: $ 50, $40, $30
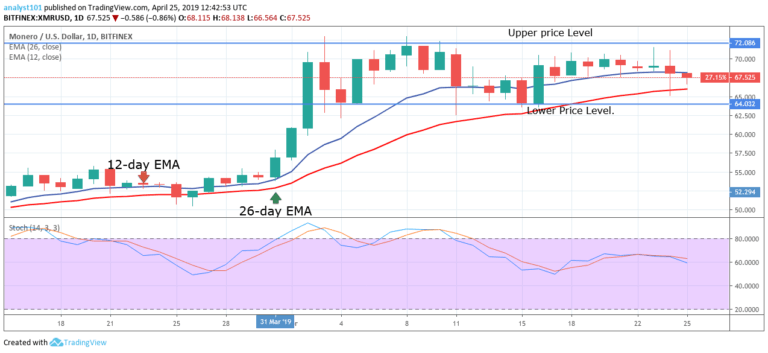
The price of Monero is in a range bound movement. Since April 2, and today, the crypto’s price was trading between the levels of $64 and $72. The bulls failed to break the $72 resistance level. Each time the bulls were resisted the crypto’s price would fall to the $64 support level for a bullish trend resumption.
However, if the bulls and the bears fail to break their respective levels, the crypto’s price may encounter a price breakout or a price breakdown. From the daily chart, if the price breaks out at the $72 resistance level the crypto’s price will rally above the $110 price level.
Similarly, if the price breaks down at the $64 support level, the crypto’s price will fall to a low at $52. Meanwhile, the Stochastic is in the overbought region but below the 80% range. This indicates that the price is in a bearish momentum and a sell signal.
XMRUSD Short-term Trend: Bearish

On the 4-hour chart, the price of Monero is ranging below the $72 resistance level. On April 23, the crypto’s price was resisted and the price fell to the bearish trend zone. The crypto’s price fell to the low at $66.42 to resume another bullish trend.
The bullish movement was to retest the 12-day EMA and the 26-day EMA. Nevertheless, the crypto’s price is below the EMAs which indicates that the price may further depreciate. Meanwhile, the Stochastic is out of the oversold region but above the 20% range. This indicates that the price is in a bullish momentum and a buy signal.
The views and opinions expressed here do not reflect that of CryptoGlobe.com and do not constitute financial advice. Always do your own research.


