

XMRUSD Medium-term Trend: Bearish
- Supply zones: $120, $130, $140
- Demand zones: $ 50, $40, $30
The price of Monero is in a bearish trend. The cryptocurrency had been in the bullish trend zone since March 31. The bulls reached a high of $70.98 but could not break the $72 resistance level. In the previous attempt to break the resistance level, the crypto’s price would fall to the 12-day EMA support level.
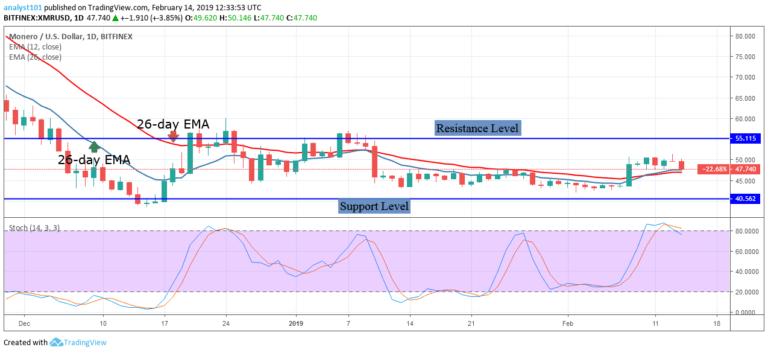
Yesterday, the bulls tested the $72 resistance level and were resisted. Today, the price is retracing and has broken the 12-day EMA support level but it is testing the $62.50 price level. The $62.50 price level is a support level for the cryptocurrency. On the downside, if the $62.50 price is broken the crypto will depreciate to the support of the $55 price level.
However, if the bears break the $55 price level, the price will further depreciate into the previous range bound zone of $40 and $55 price levels. On the upside, if the $62.50 price level holds, the crypto’s price will resume its bullish trend. Meanwhile, the Stochastic is in the overbought region but below the 80% range. This indicates that the price is in bearish momentum and a sell signal.
XMRUSD Short-term Trend: Bearish

On the 4- hour chart, the price of Monero is in a bearish trend. From the chart, the bulls had tested the $72 resistance level for the fifth time. If the bulls had broken the resistance level, a price breakout would have been powerful.
The crypto’s price is below the 12-day EMA and the 26-day EMA which indicates that the price is likely to fall. The crypto’s price is likely to depreciate to the previous low at $55 price level. Meanwhile, the Stochastic is out of the oversold region but below the 40% range. This indicates that the price is in a bearish momentum and a sell signal.
The views and opinions expressed here do not reflect that of CryptoGlobe.com and do not constitute financial advice. Always do your own research.


