
XMR/USD Long-term Trend: Ranging
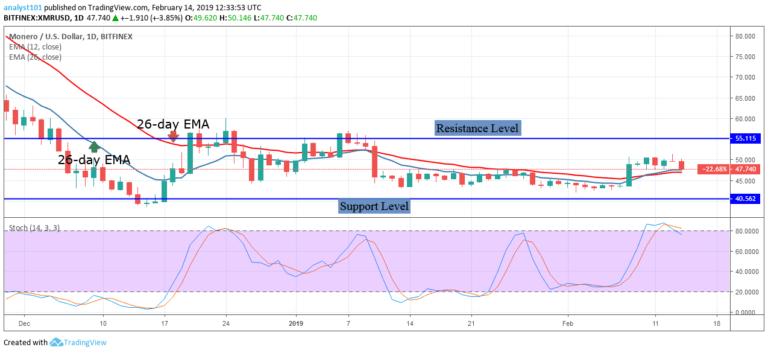
- Resistance levels: $70, $80, $90
- Support levels: $60, $50, $40
Last week, the price of Monero was in a bullish trend. The bullish trend was as a result of the crypto’s long period of range bound movement. In retrospect, the crypto’ price had traded between the levels of $40 and $55 in the last three months. On March 31, the bulls broke the $55 resistance level and the price of Monero appreciated in value.
Last week, a bullish trend line was drawn to determine the duration of the bullish trend. On April 3 the bullish trend was terminated. You can see the bearish candlestick that broke the trend line. And another candlestick closing on the opposite of it. On April 3, the bulls were resisted at the $72.50 resistance level.
The price made a downward correction and resumed another bullish trend. On April 8, the bulls retested the resistance level and were resisted. Presently, the price of Monero is retracing. On the upside, if price retraces to the support of the 12-day EMA, the bulls will resume another bullish trend.

If the bulls break the $72 resistance level, the crypto’s price will revisit the highs of $80 and $100 . On the other hand, if price retraces and breaks below the 12-day EMA and the 26-day EMA, the crypto will resume a downward trend. Meanwhile, the stochastic is in the overbought region but above the 80 % range. This indicates the price of Monero is in a strong bullish momentum and a buy signal.
The views and opinions expressed here do not reflect that of CryptoGlobe.com and do not constitute financial advice. Always do your own research.


