
XMR/USD Long-term Trend: Bullish
- Resistance levels: $70, $80, $90
- Support levels: $55, $0, $30
The price of Monero was in a range bound movement in the month of March. The crypto’s price had earlier been ranging between the levels of $40 and $55 in the last three months. The crypto had never traded above the $55 price level as at March 30th, 2019. However, after several attempts by the bulls, the $55 upper price level was broken by the bulls.
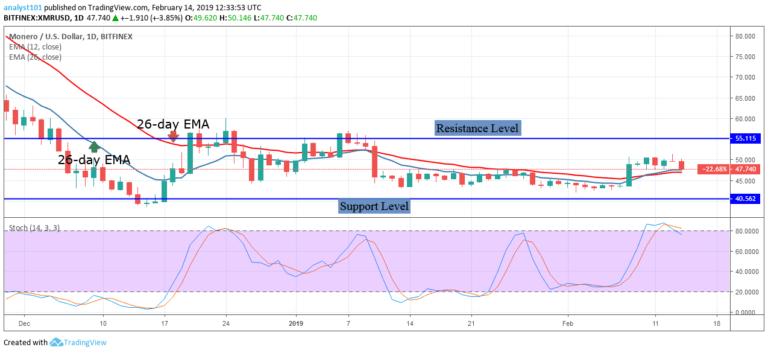
Meanwhile, on March 1, the crypto has an opening balance of $48.81. On March 31, it had a closing balance of $56.92. In other words, the price of Monero has appreciated by 16.61% of its capitalization in the month of March. Nevertheless, the crypto’s price is above the 12-day EMA and the 26-day EMA which indicates that price is likely to rise. Now for three days running, the crypto’s price is making a series of higher highs and higher lows.

A bullish trend line is drawn to determine technically the duration of the bullish trend. The assumption is that a bullish trend is ongoing if the trend line is unbroken. However, if a bearish candlestick breaks the trend line and another closes on the opposite of it; the current trend is said to be terminated.
The crypto’s price is likely to rise to either $75 or $80 price level if the price is sustained above the EMAs. Meanwhile, the stochastic is in the overbought region but above the 80 % range. This indicates that the price of Monero is in a strong bullish momentum and a buy signal.
The views and opinions expressed here do not reflect that of CryptoGlobe.com and do not constitute financial advice. Always do your own research.


