

LTCUSD Medium-term Trend: Bullish
- Resistance Levels: $60, $65, $70
- Support Levels: $60, $50, $40
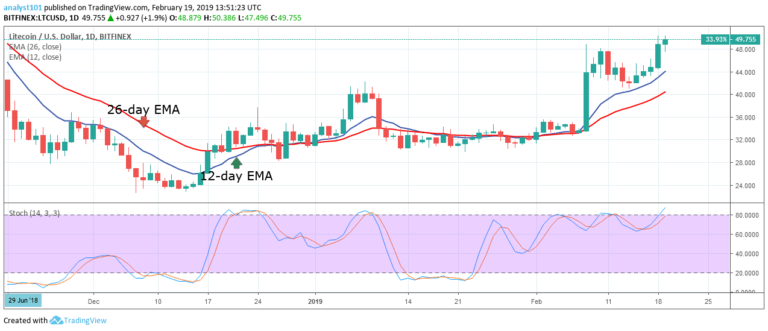
From the daily chart, the LTCUSD pair had been in a smooth uptrend in the month of March. On March 7, the bulls could not proceed with the uptrend. At each attempt at the $60 price level, the bulls would be resisted and the price would fall to the support of the 12-day EMA. However, from the chart, the horizontal price level was broken as the crypto encounters a price breakout.
On the upside, the crypto’s price will rise as long as the price is above the EMAs. Meanwhile, the stochastic is in the overbought region but above the 60% range which indicates that the crypto is in a bullish momentum and a buy signal.
LTCUSD Short-term Trend: Bullish

On the 4-hour chart, the price of Litecoin is in a bullish trend. From the chart, the 12-day EMA and the 26-day EMA were trending horizontally because the LTC price was trading below the $62 resistance level. Since on March 16, the bulls could not break the $62 resistance level.
Each attempt by the bulls to break the resistance level would lead to a price fall. Today, the LTC price has a price breakout which has broken the resistance level. The crypto’s price is above the EMAs which indicates that price is likely to rise. The LTC price is now approaching the $71 price level.
On the upside, the crypto’s price is likely to rise because the bullish trend is ongoing as the trend line is unbroken. Meanwhile, the stochastic is in the overbought region but above the 60% range which indicates that the crypto is in a bullish momentum and a buy signal.
The views and opinions expressed here do not reflect that of CryptoGlobe.com and do not constitute financial advice. Always do your own research.


