

ETHUSD Medium-term Trend: Bullish
- Resistance Levels: $230, $240, $250
- Support Levels: $150, $140, $130
From the daily chart, the price of Ethereum had been on a bullish trend since April 2. The ETH price also appreciated from $143.15 to $181.45. On April 8, the bulls reached a high of $187.98 and were resisted. The following day the price fell to a low at $176.80 and commenced a range bound movement.
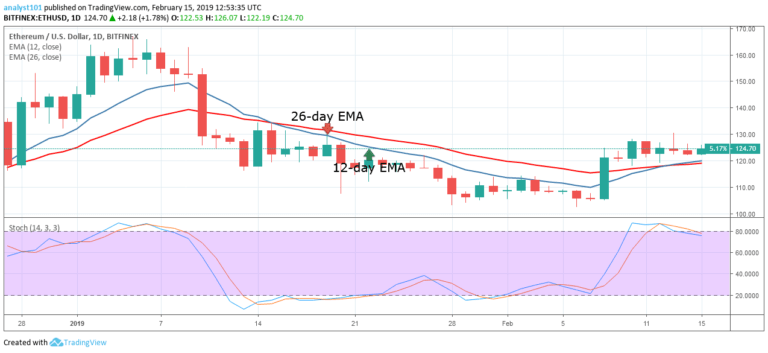
The ETH price is facing resistance at the $184 price level. The 12-day EMA and the 26-day EMA are pointing northward indicating that price is in a bullish trend. The crypto’s price is also above the EMAs which also tells us that price is likely to rise. Today, the bulls are testing the $184 resistance level.
If the bulls break the resistance level, the ETH price will reach the previous high of $200. If the bulls fail to break the resistance level, the crypto’s price will continue its range bound movement. On the other hand, it may fall to the support of the 12-day EMA and resume another bullish trend. Meanwhile, the stochastic band is at the overbought region but above the 80% range. This indicates that the price is in a strong bullish momentum and a buy signal.
ETHUSD Short-term Trend: Bullish

On the 4-hour chart, the price of Ethereum is in a bullish trend zone. On April 8, the bulls tested the $184 resistance level, and ETH price fell and commenced a range bound movement. The crypto’s price will test the $184 resistance level and fall to the support of 12-day EMA.
And the crypto’s price will resume another bullish movement. The ETH price is also trading in a tight range between the levels of $176 and $184. Meanwhile, the stochastic indicator is at the overbought region but above the 40% range which indicates that the crypto is in a bullish momentum and a buy signal.
The views and opinions expressed here do not reflect that of CryptoGlobe.com and do not constitute financial advice. Always do your own research.


