

ETHUSD Medium-term Trend: Ranging
- Resistance Levels: $230, $240, $250
- Support Levels: $130, $120, $110
On March 30, the price of Ethereum was retracing after being resisted at the $143.99 price level. The bulls have tested the $143.99 resistance level for the fourth times but failed to break the resistance level. The $143.99 price level is now a strong resistance level.
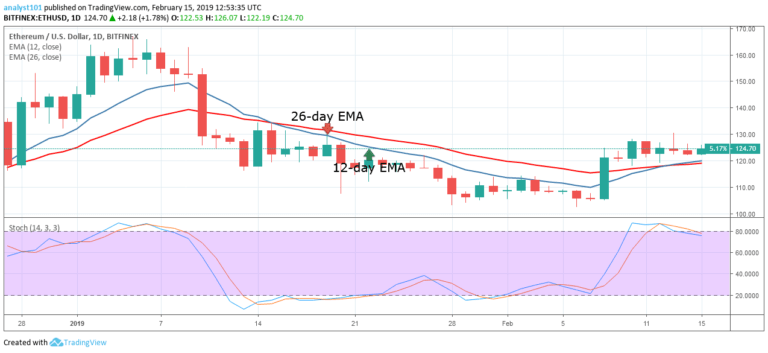
The 12-day EMA and the 26-day EMA are trending horizontally indicating that the price is in a tight range. The bulls could not break above the $143 price level neither could the bears break below the $130 price level. On the downside, if the crypto’s price has a price breakdown, the crypto’s price will fall to the low at $120 price level.
On the upside, a price breakout will make the crypto’s price rally above the $160 price level. Meanwhile, the stochastic band is at the overbought region but below the 80% range. This indicates that the price is in a bearish momentum and a sell signal.
ETHUSD Short-term Trend: Bullish

On the 4-hour chart, the price of Ethereum was in a range bound movement. On March 30, a bearish pin bar has rejected an upward price movement at the $146 price level. The crypto’s price fell to the support of the 12-day EMA to commence a range bound movement above it.
Today, the bulls were also resisted at the $145 price level as the crypto’s price fell to the support of the 12-day EMA. On the upside, if the crypto has more buyers at the upper price level, the crypto’s price will rise. Meanwhile, the stochastic band is at the oversold region but above the 40% range. This indicates that the price is in a bullish momentum and a buy signal.
The views and opinions expressed here do not reflect that of CryptoGlobe.com and do not constitute financial advice. Always do your own research.


