

BTCUSD Medium-term Trend: Bearish
- Resistance levels: $7,000, $7,200, $7,400
- Support levels: $5,300, $5,100, $4,900
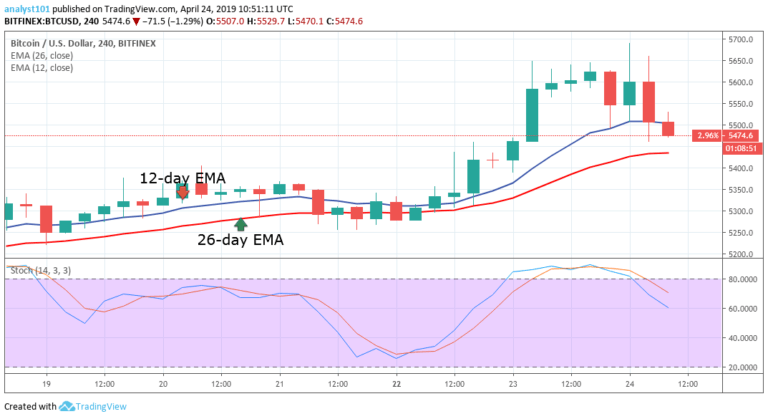
Yesterday, April 23, the BTCUSD pair was in the bullish trend zone. The bulls were facing resistance at the $5,650 resistance level. Today, the bulls were resisted as the price fell and broke the 12-day EMA, but it is approaching the 26-day EMA.
On the downside, if the bearish trend continues and the EMAs are broken, the BTC price will resume a downward trend. On the upside, if price falls and finds support at the 26-day EMA , the crypto’s price will resume its bullish trend to revisit the previous highs.
Meanwhile, the stochastic indicator is at the overbought region but below the 80% range, which indicates that the crypto’s price is in a bearish momentum, and therefore a sell signal.
BTC/USD Short-term Trend: Bearish

On the 1-hour chart, the price of Bitcoin is in a bullish trend. Yesterday, the bulls tested the $5,650 resistance level and were resisted. Today, the bulls made another attempt to break the $5,650 resistance level and there was more reaction from the bears. From the Fibonacci tool, the bears have broken the 0.236 and 0.382 retracement levels.
This implies that the price has crossed the continuation zone of the bullish trend. The market is now in a downtrend. However, if the price gets to the 0.50 and $0.618 Fib. retracement levels, the current trend is about to reverse. The BTC price is currently trading at $5,485.40 at the time of writing.
Meanwhile, the stochastic indicator is at the oversold region but below the 40% range, which indicates that the crypto is in a bearish momentum, and is therefore a sell signal.
The views and opinions expressed here do not reflect that of CryptoGlobe.com and do not constitute financial advice. Always do your own research.


