

BTCUSD Medium-term Trend: Bullish
- Resistance levels: $7,000, $7,200, $7,400
- Support levels: $4,000, $3,800, $3,600
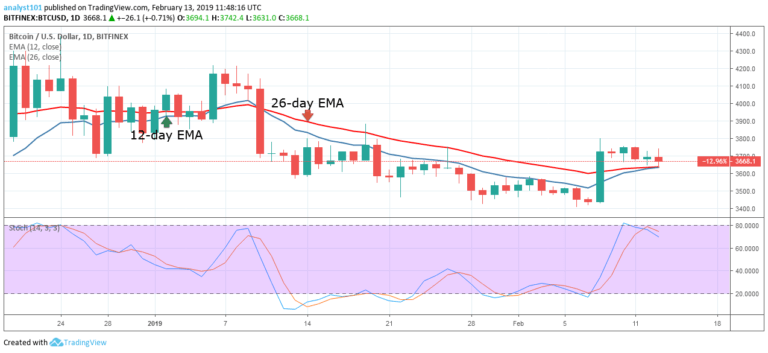
The BTCUSD pair had been in the bullish trend zone in the month of March. The bulls had systematically broken the resistance levels of price as the bulls reach the key resistance level. On March 9, the bulls were resisted at the $4,100 resistance level, and it fell to the support of the 12-day EMA to resume another bullish trend.
On March 20, the bulls were also resisted at the $4,100 price level to commence another bullish trend. The bulls have broken the resistance levels and it is testing the $4,200 price level. The bulls are likely to break the $4,200, and if that happens, the BTC price is expected to rise above the $4,500 price level.
Meanwhile, the stochastic indicator is at the overbought region but below the 80% range which indicates that the crypto is in a bearish momentum and a sell signal.
BTC/USD Short-term Trend: Bullish

On the 1-hour chart, the price of Bitcoin is in a bullish trend. The bulls have tested the $4,200 resistance level twice but fail to break it. On March 30, the bulls tested the $4,200 resistance level and were resisted. The price fell below the 12-day EMA and the 26-day EMA to commence a range bound movement.
The bulls break above the EMAs to resume another bullish trend. On April 1, the bulls tested the $4,200 resistance level but fell to the support of the 12-day EMA. On the upside, the bulls are likely to break the $4,200 price level, if the crypto’s price is sustained above the EMAs.
Meanwhile, the stochastic is at the overbought region but below the 80% range which indicates that the crypto is in a bearish momentum and a sel signal.
The views and opinions expressed here do not reflect that of CryptoGlobe.com and do not constitute financial advice. Always do your own research.


