XRPUSD Medium-term Trend: Bearish
- Resistance Levels: $0.56, $0.58, $ 0.60
- Support Levels: $0.30, $0.28, $0.26
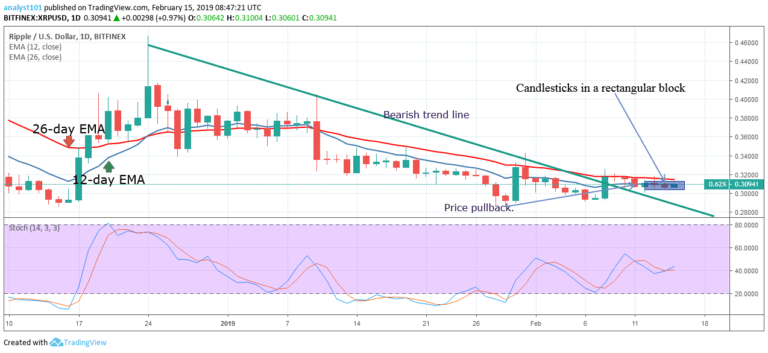
Yesterday XRP’s price was in a bearish trend. It was approaching a $0.31 low after being repelled at $0.32. Today, a bearish candlestick broke through the 12 and 26-dmay EMAs, indicating further declines are possible.
The cryptocurrency is trading within a range between the $0.28 and $0.34 marks, and if the bearish trend continues it’ll find support at the $0.30 level. If the bulls take over, it’ll rise to highs of $0.33 and $0.34.
A breakout or breakdown is expected. The Stochastic indicator is out of the overbought region but above 40 which indicates that XRP is in bullish momentum.
XRPUSD Short-term Trend: Bearish
On the 4-hour chart, XRP is in a bearish trend. As the bears broke through the EMAs, the bearish trend is likely to continue to a low of $0.30. If the crypto’s price falls to said and holds, traders should enter long positions.
The Stochastic indicator is out of the overbought region but below 40 which indicates that XRP is in bearish momentum and is a sell signal.
The views and opinions expressed here do not reflect that of CryptoGlobe.com and do not constitute financial advice. Always do your own research.


