

XRPUSD Medium-term Trend: Bearish
- Resistance Levels: $0.56, $0.58, $ 0.60
- Support Levels: $0.30, $0.28, $0.26
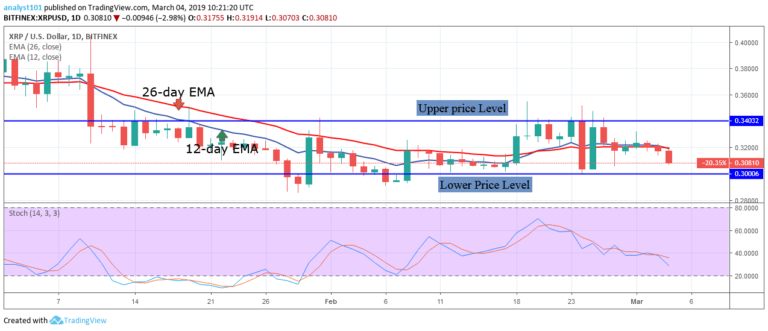
Last week, the XRPUSD pair was in a bullish trend as the crypto reached a high of $0.34. The crypto has been facing resistance at the $0.34 price level since January 10. The bears made a pull back and broke the 12-day EMA and the 26-day EMA to reach the bearish trend zone. For now, the critical levels for the crypto’s price are $0.34 and the $0.30.
The price is approaching the $0.30 price level. The crypto’s price is likely to depreciate to the lower price level before commencement of a recovery. When the crypto attempts a recovery at the lower price level, traders should initiate long orders. On the upside, if the bulls break the 12-day EMA, the 26-day EMA, and retests the previous highs of $0.34 and $0.40; then the previous analysis will be invalidated.
Meanwhile, the stochastic indicator is in the overbought region but below the 40% range which indicates that the XRP price is in a bearish momentum and a sell signal.
XRPUSD Short-term Trend: Bullish

On the 4-hour chart, the XRP price is now in a bearish trend. Last week, the crypto’s price was in a bullish and bearish trend. On February 25, the bears broke below the EMA and traded in the bearish trend zone at the $0.31 price level. On March 1, the bulls broke above the EMAs and traded above the $0.32 price level.
Today the bears have the upper hand as the price approached the $0.30 price level. Meanwhile, the stochastic indicator is in the oversold region but below the 20% range which indicates that the XRP price is in a strong bearish momentum and a sell signal.
The views and opinions expressed here do not reflect that of CryptoGlobe.com and do not constitute financial advice. Always do your own research.


