 XRP Chart By Trading View
XRPUSD Medium-term Trend: Bullish
- Resistance Levels: $0.56, $0.58, $ 0.60
- Support Levels: $0.30, $0.28, $0.26
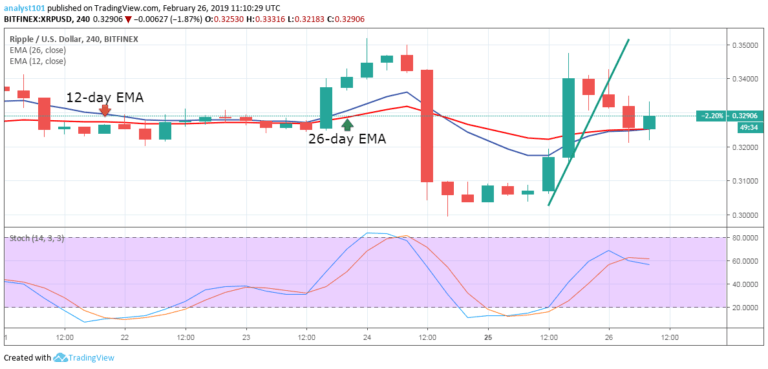
The XRPUSD pair had been in a bearish trend in the last four days. On February 25, the bulls took price to the high of $0.34 but were resisted. The crypto’s price had a downward correction whereby the price slides below the exponential moving averages. The XRP price fell to a low of $0.31 and traded in the bearish trend zone.
Today, March 1, the bulls have broken above the EMAs and it is trading in the bullish trend zone. The crypto’s price is approaching the $0.33 price level. If the bulls sustain hold at the higher price level; the XRP price will reach the highs of $0.34 and $0.40. On the downside, if the crypto’s price falls below the 12-day EMA and the 26-day EMA again, the crypto will fall and find support at $0.31 price level.
Meanwhile, the stochastic indicator is in the overbought region and above the 80 % range which indicates that the XRP price is in a strong bullish momentum and a buy signal.
XRPUSD Short-term Trend: Bullish
 XRP Chart By Trading View
On the 1-hour chart, the XRP price is in a bullish trend. In the previous day, the XRP price had been in a range bound movement above the $0.31 price level. The 12-day EMA and the 26-day EMA were trending horizontally indicating the range bound movement. Today, the bulls have reached a high of $0.3297 and the price made a retracement.
The crypto’s price has resumed its bullish movement after the retracement. Meanwhile, the stochastic indicator is in the overbought region but above the 80 % range which indicates that the XRP price is in a strong bullish momentum and a buy signal.
The views and opinions expressed here do not reflect that of CryptoGlobe.com and do not constitute financial advice. Always do your own research.