XRPUSD Medium-term Trend: Bearish
- Resistance Levels: $0.56, $0.58, $ 0.60
- Support Levels: $0.30, $0.28, $0.26
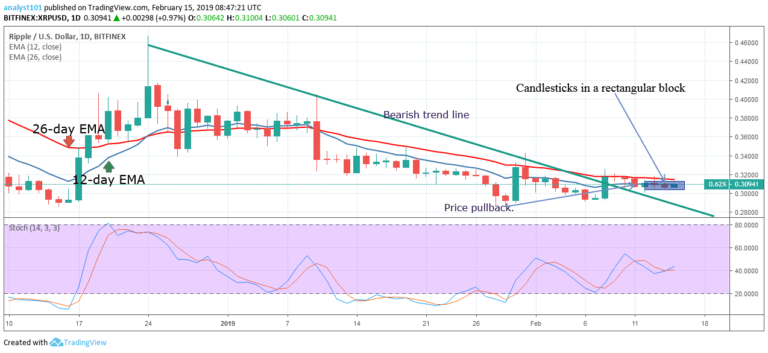
XRP’s price has been range-bound between the $0.28 and $0.34 levels. On January 10, the bears broke the support on the lower end, and today the support has turned into a resistance, unbroken since January 10.
On January 29, the crypto’s price fell to its low of $0.28. This level also remained intact since January 10. Therefore, the crypto’s price now ranges between $0.28 and $0.34. XRP’s resistance level is likely to be broken by a price breakout. Similarly, its support level is likely to be broken by a price breakdown.
Meanwhile, the Stochastic indicator is out of the overbought region but above 20 which indicates that the XRP price is in bullish momentum and is a buy signal.
XRPUSD Short-term Trend: Bearish
Yesterday, March 6, XRP was in a bullish trend. A trend line was drawn to determine the duration of the bullish trend. Yesterday, a Doji candlestick broke the trend, as it appeared on the opposite side of the line.
Today, the crypto’s price is falling as it resumes its downward trend. Meanwhile, the Stochastic indicator is out of the overbought region but below 80, which indicates that XRP is in bearish momentum and is a sell signal.
The views and opinions expressed here do not reflect that of CryptoGlobe.com and do not constitute financial advice. Always do your own research.


