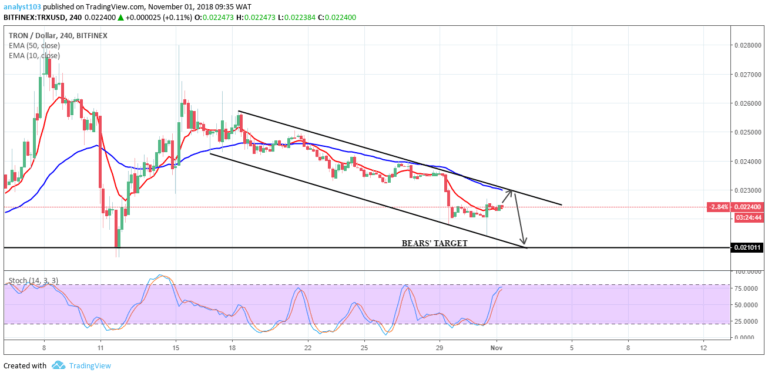
TRX/USD Medium-term Trend: Bearish
- Supply zones: $0.04000, $0.05000, $0.06000
- Demand zones: $0.01000, $0.00900, $0.00800
TRON’s TRX is in a bearish trend in its medium-term outlook. A breakdown near its EMAs created a bearish railroad on March 7, which led to the bears’ return and downward price movement, leading to a $0.02335 low. Today’s 4-hour opening candle at $0.02342 was bearish.
With the price below its EMAs, the downward trend is seen as a strong one. The Stochastic Oscillator signal points down at 8, further confirming the downward momentum.
The 61.8 or 50.0 fib areas at $0.02237 and $0.02279 may be retested due to increased bearish pressure.
TRX/USD Short-term Trend: Bearish
The cryptocurrency is in a bearish trend in its short-term outlook. $0.02409 in the supply area was the high of yesterday’s session. TRX’s price is below its two EMAs with the Stochastic Oscillator being in the oversold region, suggesting a minor uptrend may soon occur, before the price keeps dipping.
$0.02250 in the demand area remains the bears’ target in the short-term
The views and opinions expressed here do not reflect that of CryptoGlobe.com and do not constitute financial advice. Always do your own research.


