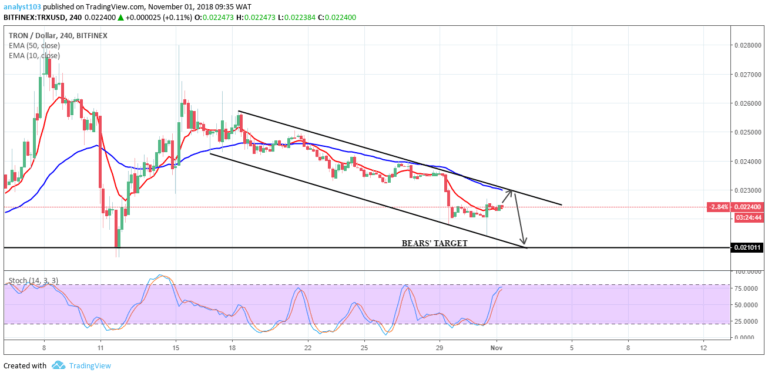
TRX/USD Medium-term Trend: Bearish
- Supply zones: $0.04000, $0.05000, $0.06000
- Demand zones: $0.01000, $0.00900, $0.00800
TRON is in a bearish trend in its medium-term outlook. Bearish pressure from a large engulfing candle on March 25 was sustained yesterday, despite a bullish opening at $0.02280. TRX’s price went down to $0.02217 in the demand area before exhaustion set in.
The price went up to $0.02260 before the end of yesterday’s session as a correction was necessary. This was sustained as the market opened today with a a bullish engulfing candle at $0.02269 as TRX rose to $0.02305 in the supply area.
TRON’s current correction may end at the 50.0 fib area, with the bulls pushing forward, according to indications from the Stochastic Oscillator’s signal, at 62. It suggests upward momentum, although the bears may come back at the 38.2 fib area.
TRX/USD Short-term Trend: Ranging
The cryptocurrency is in a range-bound trend in its short-term outlook. Bearish momentum was lost after TRX got to $0.02217 in the demand area due to the formation of a bear fortress. The bulls’ return was signaled by the break of the 10-day EMA.
TRX’s price at $0.023 is currently above its two EMAs. It’s currently ranging between $0.02356 and $0.02218, with a breakdown or a breakout both being possible, meaning patience before taking a position is advised.
The views and opinions expressed here do not reflect that of CryptoGlobe.com and do not constitute financial advice. Always do your own research.


