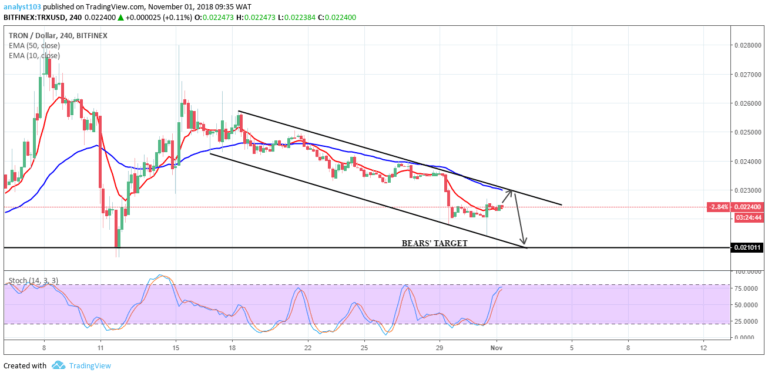
TRX/USD Medium-term Trend: Bearish
- Supply zones: $0.04000, $0.05000, $0.06000
- Demand zones: $0.01000, $0.00900, $0.00800
TRON remains in a bearish trend in its medium-term outlook. The bearish pressure remained strong as TRXUSD goes into a brief consolidation around the 50 fib area after the price dropped to $0.02300. The high within the fib area was $0.02330 in the supply area as the session ended yesterday.
The bearish railroad formed after today’s opening candle at $0.02330 signaled a possible downtrend continuation within the range as TRXUSD is already down at $0.02310 in the demand area.
The price is hovering around the two EMAs and the stochastic oscillator signal is down an indication of downward momentum in price in the medium-term.
The 38.2 fib area, a trend continuation zone is the bears’ target as the bears’ pressure becomes stronger and more candles opened and closed below the EMAs.
TRX/USD Short-term Trend: Ranging
The cryptocurrency is a range-bound market in its short-term outlook. $0.02298 was the low while $0.02330 was the high as TRXUSD consolidated during yesterday session. The cryptocurrency was up at $0.02331 in the supply area shortly after today’s opening, but the bear returned with a bearish marubozu and dropped TRXUSD to $0.02310.
The stochastic oscillator signal is up at 46% an indication that the bulls are back in control and may continue the upward price movement within the range.
$0.02340 in the supply area is the upper price range while $0.02290 in the demand area is the lower price range. A breakout from the upper supply area or a breakdown from the lower demand area may occur hence patience is required for this to play out before taking a position.
The views and opinions expressed here do not reflect that of CryptoGlobe.com and do not constitute financial advice. Always do your own research.


