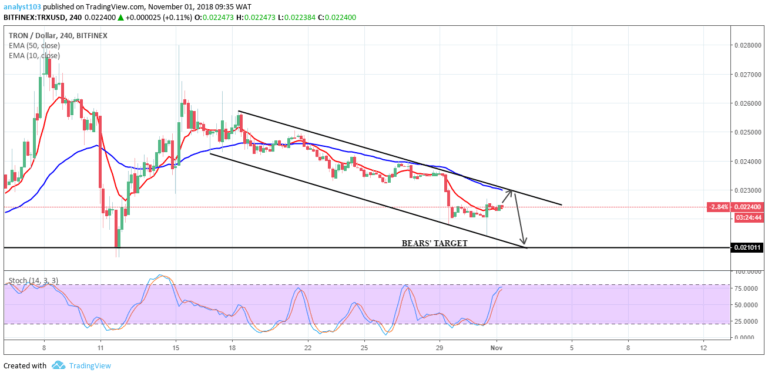
TRX/USD Medium-term Trend: Bearish
- Supply zones: $0.04000, $0.05000, $0.06000
- Demand zones: $0.01000, $0.00900, $0.00800
TRON is in a bearish trend in its medium-term outlook. The bullish pressure was lost on 12th March at $0.02400 in the supply area which was the 78.2 fib level a strong reversal zone as exhaustion set in denoted by the wick in the inverted hammer. The large bearish engulfing candle confirmed the bears hold of the market as TRXUSD dropped to $0.02318 in the demand area late yesterday.
The break of the 10-EMA after today’s opening suggests that the bears are back to sustain the downward momentum as the price dropped to $0.02300 in the demand area.
The price is below the two EMAs and the stochastic oscillator signal is pointing down at 22% an indication of further downward momentum due to the bearish in the medium-term. $0.02207 in the demand area is set for a retest.
TRX/USD Short-term Trend: Bearish
The cryptocurrency is a bearish trend in its short-term outlook. The large bearish engulfing candle at $0.02389 on 16th March and the bearish marubozu candle formed shortly after today’s opening at $0.02363 signalled the bears’ increased momentum.
The structure of TRXUSD is a capital M in the short-term. The right leg of the letter is forming as the bears increase the momentum to the downside.
The price is below the two EMAs crossover and currently made a low at $0.02300 in the demand area. it suggests a further downward movement to $0.02280 to complete the right leg of the letter M.
The views and opinions expressed here do not reflect that of CryptoGlobe.com and do not constitute financial advice. Always do your own research.


