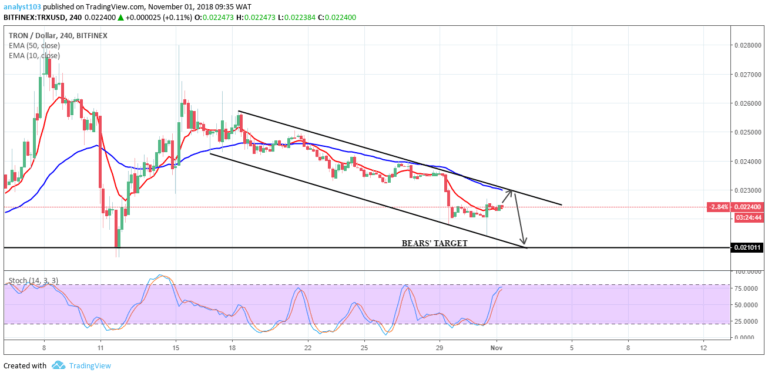
TRX/USD Medium-term Trend: Bearish
- Supply zones: $0.04000, $0.05000, $0.06000
- Demand zones: $0.01000, $0.00900, $0.00800
TRON continues in a bearish trend in its medium-term outlook. The journey down south continues with the 61.8 fib area predicted broken and the price dropped to $0.02219 in the demand area at the opening of the market yesterday. A further drop to $0.02206 occurred due to the bears’ pressure. Correction to the impulse move saw the bulls pushed back the TRXUSD to $0.02297 in the supply area. This was necessary to confirm the downtrend continuation.
The wick in the candle connote exhaustion and subsequent bears return. Today’s opening 4-hour candle at $0.02269 also closed with wick as the bears gather momentum for the push downward with the cryptocurrency currently down to $0.02219 in the demand area.
The retest of 61.8 fib area will see TRXUSD down to the 78.2 fibs in the medium term as the bears’ pressure becomes much stronger.
TRX/USD Short-term Trend: Bearish
The cryptocurrency is in a bearish trend in its short-term outlook. The bearish pressure remains strong despite the fact the bulls had a brief control at $0.02280 in the supply area. The bears returned after today’s 1-hour opening candle and continued the journey down. TRXUSD is already down at $0.02257 in the demand area.
The price lies below the two EMAs crossover with the stochastic oscillator signal pointing down at 19% in the oversold region, an indication of further downward movement.
The bears’ target is $0.02210 in the demand area in the short-term.
The views and opinions expressed here do not reflect that of CryptoGlobe.com and do not constitute financial advice. Always do your own research.


