

XMRUSD Medium-term Trend: Ranging
- Supply zones: $120, $130, $140
- Demand zones: $ 50, $40, $30
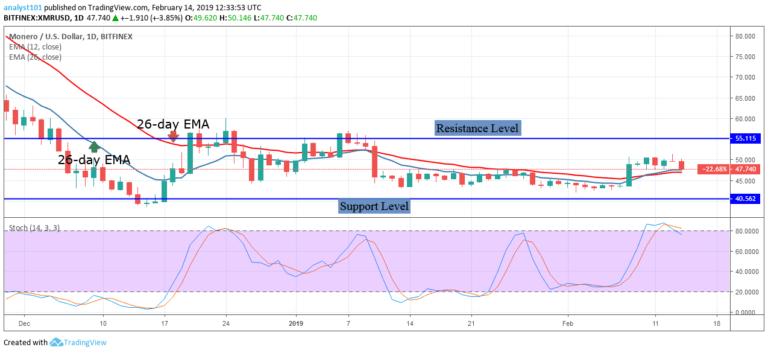
The price of Monero had been trading in a sideways trend. The crypto’s price ranges between the levels of $40 and $55. The $55 upper price level has remained unbroken in the last three months. Nevertheless, the bulls had made concerted efforts to break the resistance level.
The crypto’s price is above the 12-day EMA and the 26-day EMA which indicates that the crypto’s price is likely to rise. The crypto’s price has risen and tested the $55 upper price level but unable to break it. The bulls have tested the upper price twice in the month of March.
Each time the bulls tested the upper price level, the crypto’s price would fall to the support of EMAs. A range-bound trader should initiate a short trade at the upper price level. And a long trade at the lower price level. On the upside, a price breakout from the support of the EMAs will break the upper price level.
Meanwhile, the Stochastic is in the overbought region but above the 40% range. This indicates that the price is in bullish momentum and a buy signal.
XMRUSD Short-term Trend: Bullish

On the 4- hour chart, the price of Monero is in a bullish trend. On March 20, the bulls tested the upper price level, but the bears broke the 12-day EMA and 26-day EMA to reach the bearish trend zone. The crypto’s price fell to the low at $50.77 to commence another bullish trend.
The crypto’s price is now above the EMAs which indicates that the price will rise to test the $55 upper price level. Meanwhile, the Stochastic is out of the overbought region but above the 80% range. This indicates that the price is in a strong bullish momentum and a buy signal.
The views and opinions expressed here do not reflect that of CryptoGlobe.com and do not constitute financial advice. Always do your own research.


