

XMRUSD Medium-term Trend: Ranging
- Supply zones: $120, $130, $140
- Demand zones: $ 45, $40, $30
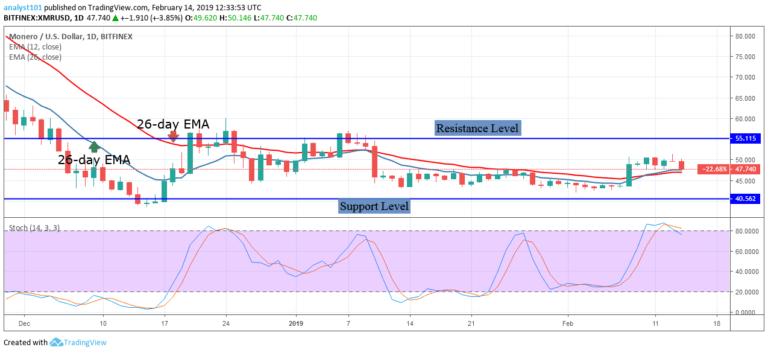
The price of Monero had been trading between the levels of $40 and $55 in the last three months. The bulls had tested the upper price level for about five times without breaking it. This makes the $55 price level a strong resistance level.
Nevertheless, the crypto’s price had been above the 12-day EMA and the 26-day EMA which indicates that the price had been rising. On March 20, the bulls tested the upper price level. Today, the crypto’s price is falling. This gives the range-bound trader an opportunity to initiate a short trade.
This short trade should be exited near the lower price level or when the bearish pressure is exhausted. On the downside, the crypto’s price is likely to fall to a low at $48. Meanwhile, the Stochastic is in the overbought region but below the 80% range. This indicates that the price is in bearish momentum and a sell signal.
XMRUSD Short-term Trend: Bearish

On the 4- hour chart, the price of Monero is in a bullish trend. The crypto’s price is trending above 12-day EMA and the 26-day EMA which indicates that the price is rising. On March 16, the bulls tested the $54 resistance level and the price fell to the support of the EMAs.
Yesterday, a bullish pin bar tested the $54 resistance level and the bears commenced their downward trend. The price of Monero is likely to fall to the previous lows of $48 or $51. Meanwhile, the Stochastic is out of the overbought region but below the 80% range. This indicates that the price is in a bearish momentum and a sell signal.
The views and opinions expressed here do not reflect that of CryptoGlobe.com and do not constitute financial advice. Always do your own research.


