
XMR/USD Long-term Trend: Ranging
- Resistance levels: $120, $130, $140
- Support levels: $50, $40, $30
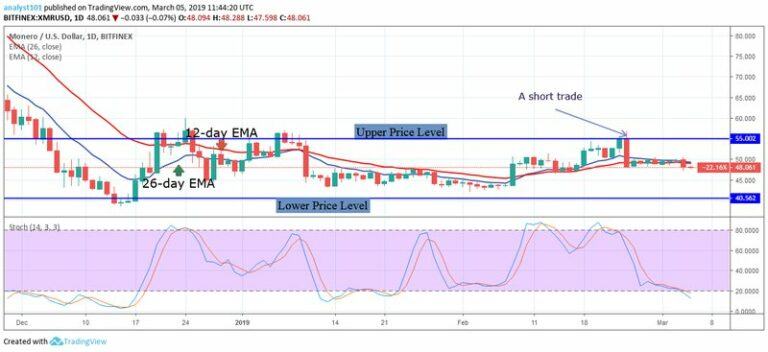
The price of Monero is trading within the range-bound levels of $40 and $55. On February 24, the bulls failed to break the $55 resistance level. The crypto’s price fell to a low of $48.21 and commenced a range bound movement. Today, the crypto’s price is trading above the $48 price level. In retrospect, On February 1, the crypto has an opening balance of $44.22.
At the close of February 28, the price of Monero stood at $48.82. In other words, the crypto’s price appreciated by 10.4% of its capitalization in the month of February 2019. Today, the price of Monero is below the 12-day EMA and the 26-day EMA which indicates that the crypto is likely to fall. On the downside, if the bearish trend continues the crypto is likely to fall to the previous low at $43. If the crypto does fall, the bears would have erased the previous gains of the bulls.

Traders should initiate long orders if the crypto’s price falls to the lower price level. Meanwhile, the Stochastic indicator is in the oversold region but below the 20% range. This indicates that the crypto’s price is in a strong bearish momentum and a sell signal. The crypto’s price is below the 12-day EMA and the 26-day EMA which indicates that price is in the bearish trend zone.
The views and opinions expressed here do not reflect that of CryptoGlobe.com and do not constitute financial advice. Always do your own research.


