
 Ethereum Chart By Trading View
ETHUSD Medium-term Trend: Bullish
- Resistance Levels: $230, $240, $250
- Support Levels: $130, $120, $110
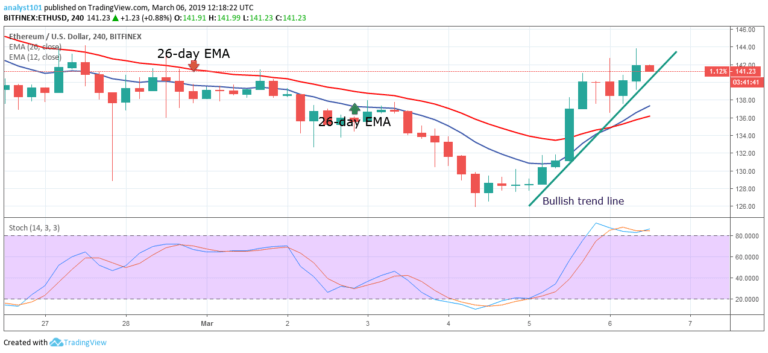
Yesterday, March 5, the price of Ethereum was in a bullish trend after seeing range bound movements. Initially, ETH was ranging above the $128 level while in a bearish trend. The bulls broke out of the range and surpassed the 12-day EMA and the 26-day EMA as the price reached a high of $141.60.
Ethereum’s price is likely going to face resistance at $160. Nevertheless, a bullish trend line has been drawn to determine the duration of the trend. It’s assumed that if ETH breaks the trend line and the following candlestick closes on the other side, then the trend is over.
From the chart, the bullish trend is ongoing because the trend line hasn’t been broken. Meanwhile, the Stochastic indicator is in the overbought region and above 80. This indicates the price is influenced by a strong bullish momentum and is a buy signal.
ETHUSD Short-term Trend: Bullish
 Ethereum Chart By Trading View
On the 1-hour chart, the price of Ethereum is in a bullish trend. The 12-day and the 26-day EMA are moving northwards indicating so. A bullish trend line has been drawn showing the support levels ETH currently has.
The bullish trend will be terminated if a candlestick breaks the trend line. Nevertheless, the Stochastic indicator is out of the overbought region but above 60 which indicates the price is in a bullish momentum and is a buy signal.
The views and opinions expressed here do not reflect that of CryptoGlobe.com and do not constitute financial advice. Always do your own research.


