

ETHUSD Medium-term Trend: Ranging
- Resistance Levels: $230, $240, $250
- Support Levels: $130, $120, $110
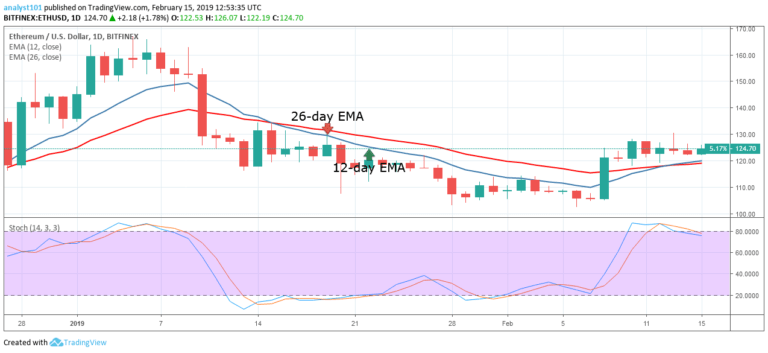
The price of Ethereum has been in the bearish trend zone after testing the $140 resistance level which is the horizontal line. The bears had earlier broken below the 12-day EMA and the 26-day EMA before the price fell into the bearish trend zone. The crypto’s price fell to the $130 support level before the commencement of the bullish trend.
Today, March 15, the bulls are making attempt to break above the EMAs. On the upside, the ETH price will revisit the $140 resistance level, if the bulls break above the EMAs. On the other hand, if the bulls fail to break above the EMAs, the crypto’s price will fall.
Meanwhile, the stochastic band is out of the oversold region but above the 40% range. This indicates that price is in a bullish momentum and a buy signal.
ETHUSD Short-term Trend: Bullish

On the 4-hour chart, the price of Ethereum is in the bullish trend zone. The bulls had made a number of attempts before breaking the EMAs. On March 12, the bulls were resisted by the 26-day EMA as the price fell to the previous lows. On March 15, the bulls broke the EMAs to commence the bullish trend.
A trend line is drawn to determine the duration of the trend. If price breaks the trend line, the trend will be terminated. Nevertheless, the stochastic indicator is out of the oversold region but above the 60% range which indicates that the price is in a bullish momentum and a buy signal.
The views and opinions expressed here do not reflect that of CryptoGlobe.com and do not constitute financial advice. Always do your own research.


