

BTCUSD Medium-term Trend: Bullish
- Resistance levels: $7,000, $7,200, $7,400
- Support levels: $3,900, $3,700, $3,500
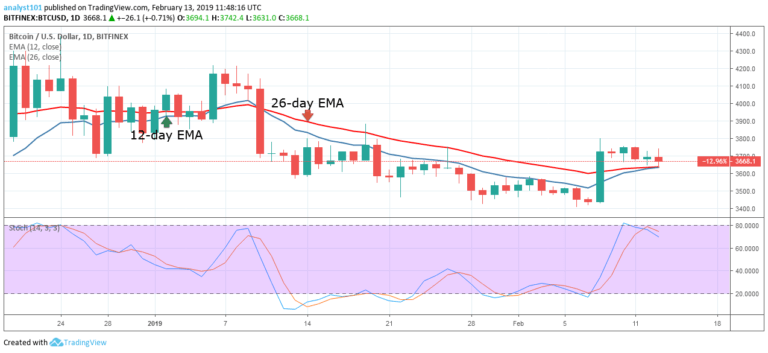
On February 23, the bulls failed to break the $4,200 resistance level. The bulls faced resistance and the price of bitcoin fell and dropped below the 12-day EMA and the 26-day EMA. The crypto’s price fell to a low of $3,831.30. The bulls then made a pullback above the EMAs. BTC has been trading between $3,800 and $4,200.
Bitcoin has found support at the 26-day EMA. A breakout may occur if the cryptocurrency manages to break through the $4,100 and $4,200 levels. If they end up facing resistance, BTC will drop below its EMAs. The Stochastic indicator is in the overbought region above 40, indicating the crypto is in a bullish trend being a buy signal.
BTC/USD Short-term Trend: Ranging

On the 4-hour chart, the price of Bitcoin is in a bullish trend. BTC has been facing resistance as the bulls failed to reach $4,200. On March 21, they tested the $4,125 resistance level and the crypto’s price fell below the EMAs.
Today, the bulls have broken the EMAs which indicates that the price is likely to rise. The Stochastic indicator is in the overbought region below 80, indicating BTC is in a bullish trend and being a sell signal.
The views and opinions expressed here do not reflect that of CryptoGlobe.com and do not constitute financial advice. Always do your own research.


