

BTCUSD Medium-term Trend: Ranging
- Resistance levels: $7,000, $7,200, $7,400
- Support levels: $3,800, $3,600, $3,400
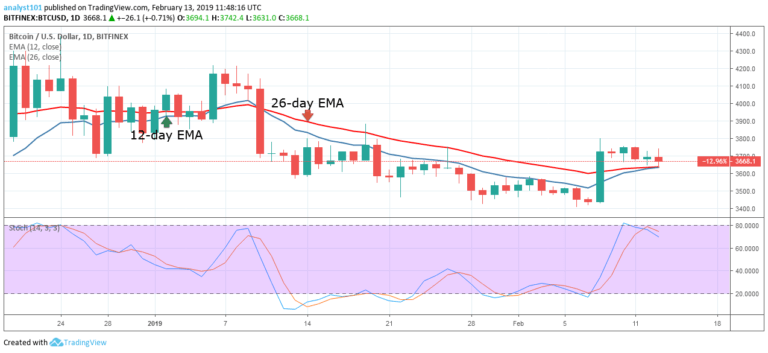
On March 25, the price of Bitcoin had been in the bullish trend zone. The crypto’s price was above the 12-day EMA and the 26-day EMA which indicated that the price was going to rise. The price of Bitcoin rose but the bulls failed to break the $4,000 and $4,200 price levels.
While in the bullish trend zone the crypto’s price was trending at the support of the 12-day EMA. On March 16, the bulls tested the $4,000 resistance level and the price made a downward correction. On the downside, if the bears break below the EMAs, the BTC price will resume its downtrend movement.
On the upside, if the price retraces to the support of the 12-day EMA, the bulls will resume their bullish movement and retest the previous highs. Meanwhile, the stochastic indicator is out of the overbought region but below the 80% range which indicates that the crypto is in a bearish momentum and a sell signal.
BTC/USD Short-term Trend: Bullish

On the 4-hour chart, the price of Bitcoin was in a bullish trend in the previous week. On March 16, after testing the $4,040 resistance level, the crypto’s price fell to the support level of the 12-day EMA. Today, the bulls tested the $4,000 price and the price fell to break the 12-day EMA.
If the price continues its fall, the bears will break the 26-day EMA and find support at the $3,800 price level. Meanwhile, the stochastic band is out of the overbought region but below the 60% range which indicates that the crypto is in a bearish momentum and a sell signal.
The views and opinions expressed here do not reflect that of CryptoGlobe.com and do not constitute financial advice. Always do your own research.


