

BTCUSD Medium-term Trend: Ranging
- Resistance levels: $7,000, $7,200, $7,400
- Support levels: $3,800, $3,600, $3,400
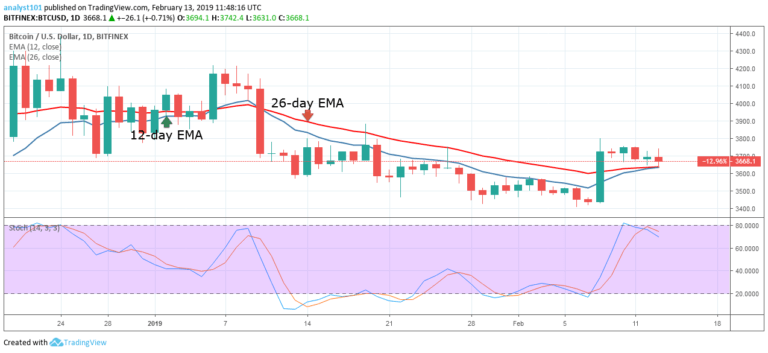
On February 23, the BTCUSD pair reached a high of $4,255 but the bulls faced resistance at the $4,200 price level. The crypto’s price fell and closed at a price of $3,831.30. The bulls recovered at the price of $3,966.50 and commenced a range bound movement. The crypto recovery was at the resistance of the 12-day EMA.
The bulls have been struggling to break above the 12-day EMA. A Doji candlestick has been spotted among the price bars which described the indecision of buyers and sellers at the $3,900 price level. However, a price breakdown or a price breakout may occur if the crypto continues its range bound movement.
On the upside, a price breakout will see the bulls break the EMAs, retest or break the $4,255 resistance level. On the downside, a price breakdown will depreciate the crypto to the low of $3,400 price level. Meanwhile, the stochastic band is out of the overbought region but above the 40% range which indicates that the crypto is in a bullish momentum and a buy signal.
BTC/USD Short-term Trend: Ranging

On the 4-hour chart, the price of Bitcoin is in a range bound movement. At the low of $3,831.30, the bulls made a bullish movement to the high of $3,900 and commenced a range bound movement. The crypto’s price has been characterized by small body candlesticks which could not break the EMAs.
Meanwhile, the stochastic band is out of the overbought region but above the 40% range which indicates that the crypto is in a bullish momentum and a buy signal.
The views and opinions expressed here do not reflect that of CryptoGlobe.com and do not constitute financial advice. Always do your own research.


