
BTCUSD Long-term Trend – Ranging
- Distribution territories: $5,000, $5,500, $6,000
- Accumulation territories: $3,000, $2,500, $2,000
Bitcoin’s price against the US dollar has been moving within a specific range for a while and has now recently crossed the $4,000 mark. The mark was expected to be breached before but the cryptocurrency has been having weak force to do so.

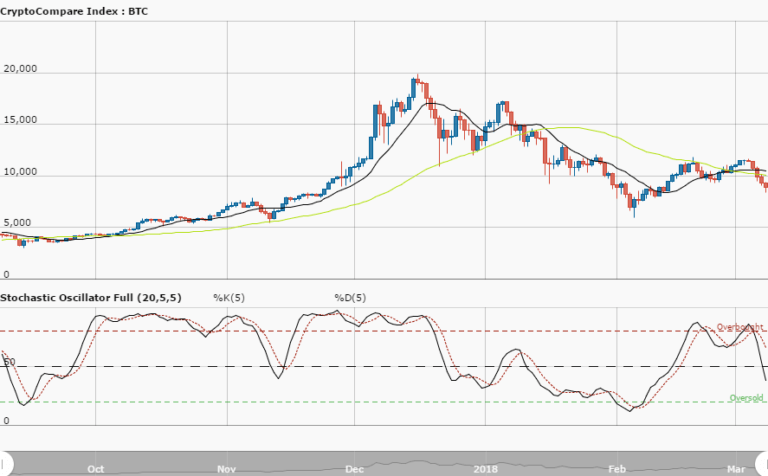
BTC’s 14-day SMA has been moving along its price line, while the 50-day SMA is located shortly below it. The Stochastic Oscillators have moved into the overbought zone and are now apparently attempting to cross within it.
Indicators still show BTC lacks strength to move upward, and still show the bears are going to lose force in the long run as well. Its current range is between $4,500 and $3,500. Before dropping, the bulls may still help Bitcoin rise in the near future.
The views and opinions expressed here do not reflect that of CryptoGlobe.com and do not constitute financial advice. Always do your own research.


