

BTCUSD Medium-term Trend: Bearish
- Resistance levels: $7,000, $7,200, $7,400
- Support levels: $3,800, $3,600, $3,400
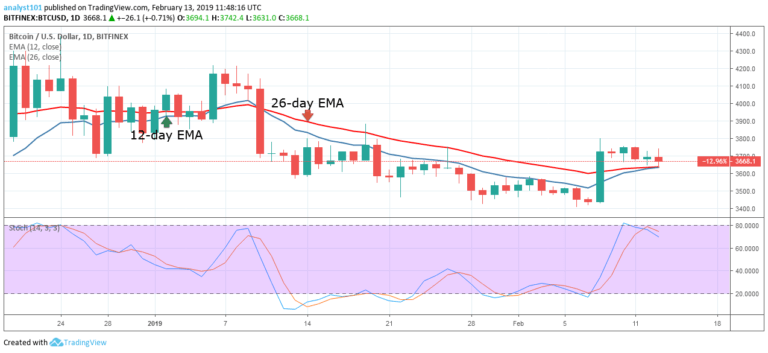
In the previous week, the BTCUSD pair was in a sideways trend. The crypto was fluctuating between the $3,800 and $3,900 price levels in the last six days. The crypto’s price was trending at the 12-day EMA but above the 26-day EMA. Today, the bears have broken below the 12-day EMA and the 26-day EMA which indicates that price is likely to fall.
The crypto’s price is currently trading at $3,806.10 as at the time of writing. On the downside, if the bears break the support level at $3,800, the crypto’s price is likely to revisit the lows of $3.600 and $ 3,700. On the other hand, if the bears fail to break the support level, the crypto’s price will commenced a range bound movement.
Meanwhile, the stochastic band is out of the overbought region but below the 40% range which indicates that the crypto is in a bearish momentum and a sell signal.
BTC/USD Short-term Trend: Bearish

On the 4-hour chart, the price of Bitcoin was in a bearish trend. Last week the 12-day EMA and the 26-day EMA were trending horizontally indicating that the price of Bitcoin was in a sideways trend. Today, March 4, the bears have broken below the EMAs and are attempting to break the $3,800 support level.
The crypto’s price is below the EMAs which indicates that the BTC price is likely to fall. The $3,800 price level may be broken. Meanwhile, the stochastic band is in the oversold region but above the 20% range which indicates that the crypto is in a bearish momentum and a sell signal.
The views and opinions expressed here do not reflect that of CryptoGlobe.com and do not constitute financial advice. Always do your own research.


