

XRPUSD Medium-term Trend: Bearish
- Resistance Levels: $0.56, $0.58, $ 0.60
- Support Levels: $0.27, $0.25, $0.23
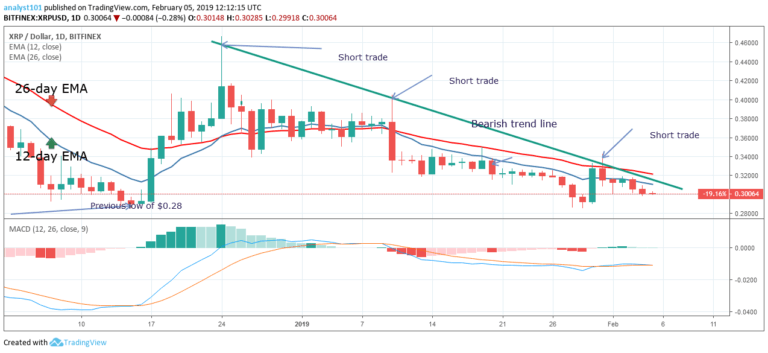
The XRP price is still in the bearish trend zone as the crypto closed at a price of $0.29. From the daily chart, we are waiting to see when the price action will tell us about the trend line being broken. Also, to determine when the price tests the trend line and bounces back. On three occasions, the XRP price tested the trend line and bounced back which resulted in a downward trend.
Today, the crypto has done none of the above but the bearish pressure is continuing as at the time of writing. Today, if the crypto’s price tests the trend line and bounces back, the crypto will continue its downward trend. On the upside, if the bulls break the trend line and the following candlestick closes on the opposite of it; the trend is terminated.
Meanwhile, the stochastic band is out of the oversold region, but below the 40% range. This indicates that the price is in a bearish momentum and a sell signal.
XRPUSD Short-term Trend: Bearish

On the 4-hour chart, the XRP price is in the bearish trend zone. On February 7, the crypto was in a bullish trend which was resisted by the 12-day EMA. Today, the XRP price is in a downward trend. Meanwhile, the XRP price is below the EMAs which indicates that the price is likely to fall. Also, the stochastic is out of the oversold region and above the 20% range. This indicates that the XRP price is in a bullish momentum and a buy signal.
The views and opinions expressed here do not reflect that of CryptoGlobe.com and do not constitute financial advice. Always do your own research.


