

XRPUSD Medium-term Trend: Bearish
- Resistance Levels: $0.56, $0.58, $ 0.60
- Support Levels: $0.30, $0.28, $0.26
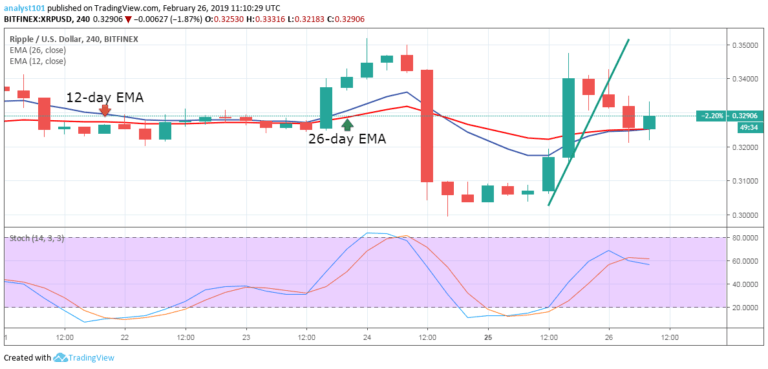
XRP’s price was in a bearish trend yesterday. On February 25, the crypto’s price faced a downward correction to a $0.32 low, after facing resistance at $0.34. On February 27, the bulls took over for several hours, before the bears regained control.
The cryptos’ drop into a bearish trend indicates the price is likely to continue going down. This could mean XRP is set to revisit lows at $0.30 or $0.29. Its Stochastic indicator is out of the overbought region, but is under range 40, indicating XRP’s price is in a bearish trend.
XRPUSD Short-term Trend: Ranging

On the 1-hour chart, XRP is in a sideways trend. Its price fell to a low of $0.31 and entered a range-bound movement. The bullish movement in the last 24 hours has been repelled by the EMAs as the crypto’s price continues to range at $0.31. At this point, XRP’s price can have either a price breakdown or a price breakout.
Meanwhile, the Stochastic indicator is in the overbought region but above 80, which indicates that XRP is in a strong bullish trend and is a buy signal.
The views and opinions expressed here do not reflect that of CryptoGlobe.com and do not constitute financial advice. Always do your own research.


