

XRPUSD Medium-term Trend: Bearish
- Resistance Levels: $0.56, $0.58, $ 0.60
- Support Levels: $0.30, $0.28, $0.26
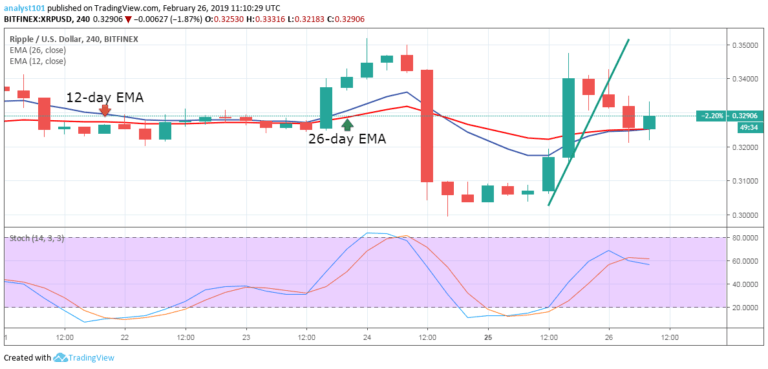
The XRPUSD pair was in a bearish trend zone yesterday. The bears broke the 12-day EMA and the 26-day EMA as the crypto’s price fell to the bearish trend zone. Today, the crypto’s price is likely to be out of the bearish trend zone. The XRP price is likely to hold at the $0.32 price level.
The bulls have broken the bearish trend line and the following candlestick closed on the opposite of it. This indicates that the bearish trend has been terminated. Traders are enjoined to initiate long trades in anticipation of a bullish trend. On the upside, the bulls are expected to break above the EMAs and the crypto’s price reaching the highs of $0.33 and $0.34.
Meanwhile, the stochastic indicator is out of the overbought region but above the 40 % range which indicates that the XRP price is in a bullish momentum and a buy signal.
XRPUSD Short-term Trend: Bullish

On the 1-hour chart, the XRP price is in a bullish trend. Today, the bearish trend fell to a low of $0.31 and commenced a bullish movement. The bulls have broken the 12-day EMA and the 26-day EMA as the price reached the bullish trend zone. The bulls are expected to retest the $0.34 resistance level and break it.
The crypto’s price is now above the EMAs. Meanwhile, the stochastic indicator is out of the oversold region but above the 40% range which indicates that the XRP price is in a bullish momentum and a buy signal.
The views and opinions expressed here do not reflect that of CryptoGlobe.com and do not constitute financial advice. Always do your own research.


