

XRPUSD Medium-term Trend: Bearish
- Resistance Levels: $0.56, $0.58, $ 0.60
- Support Levels: $0.29, $0.27, $0.25
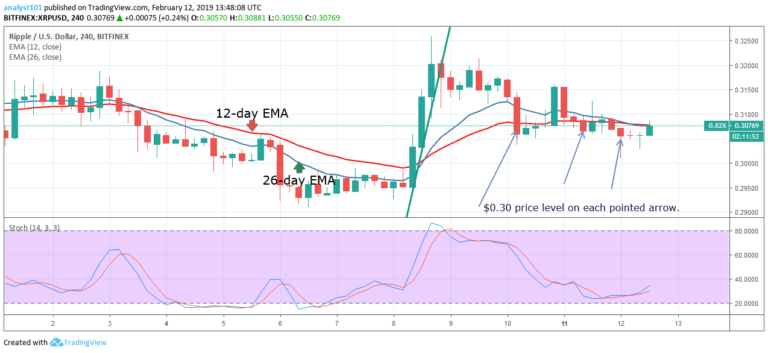
On February 8, the XRP price made some bullish gains but thereafter the price pulled back to the low of $0.30. The downward correction has made the crypto’s price fall into the bearish trend zone. The bulls have held on to the $0.30 price level for the third day. On the downside, if the bulls fail to hold on to the price, the crypto’s price will find support at the low of $0.29.
If the $0.29 price level is broken, the crypto will depreciate to the lows of $0.27 and $0.28. On the upside, the bulls are making an attempt to break above the EMAs. If the bulls have a price breakout at the $0.30 price level, the crypto will rally to the highs of $0.33 and $0.40 price level. Meanwhile, the XRP price is below the 12-day EMA and the 26-day EMA which indicates that the price is in the bearish trend zone.
Also, the stochastic band is out of the overbought region, but above the 20% range. This indicates that the price is in a bullish momentum and a buy signal.
XRPUSD Short-term Trend: Bearish

On the 1-hour chart, the XRP price was in a bearish trend zone. On February 10, the bears broke the 12-day EMA, the 26-day EMA and the price fell to the low of $0.30. The crypto’s price has been ranging at this level for the past three days. It is possible that another price breakout is imminent. The bulls are attempting to break above the EMAs.
Meanwhile, the stochastic band is out of the oversold region but above the 40% range. This indicates that the XRP price is in a bullish momentum and a buy signal.
The views and opinions expressed here do not reflect that of CryptoGlobe.com and do not constitute financial advice. Always do your own research.


