

XRPUSD Medium-term Trend: Bearish
- Resistance Levels: $0.56, $0.58, $ 0.60
- Support Levels: $0.27, $0.25, $0.23
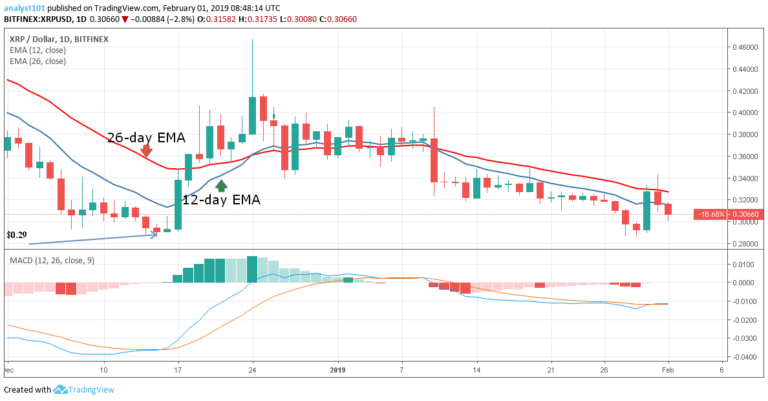
The overall view of XRP price is in a bearish trend zone. The exponential moving averages are pointing southward. In the meantime, the $0.33 price level is a strong resistance level for the XRP price. A breakout at this level will be very encouraging. Similarly, the $0.29 price level is a strong support for the cryptocurrency.
Incidentally, it was the previous low of December 15. On January 30, the XRP price appreciated to the high of $0.33 but was depreciated by the bears. The crypto is depreciating on a daily basis as per the daily bearish candlestick. Today, the crypto has depreciated to the low of $0.30. On the downside, before tomorrow it is likely to fall to the $0.29 price level.
On the upside, the bulls will have to break the EMAs and price is sustained above it before the resumption of a bullish trend. Meanwhile, the MACD line and the signal line are below the zero line which indicates a sell signal.
XRPUSD Short-term Trend: Bearish

On the 4-hour chart, the XRP price is in the bearish trend zone. On January 30, there was a price rally as the bulls reached the high of $0.34. This was short-lived as the bears erased the bullish gains. The crypto’s price is currently ranging at the $0.30 price level. Meanwhile, the stochastic indicator is out of the overbought region but below the 40% range which indicates that the price is in a bearish momentum and a sell signal.
The views and opinions expressed here do not reflect that of CryptoGlobe.com and do not constitute financial advice. Always do your own research.


